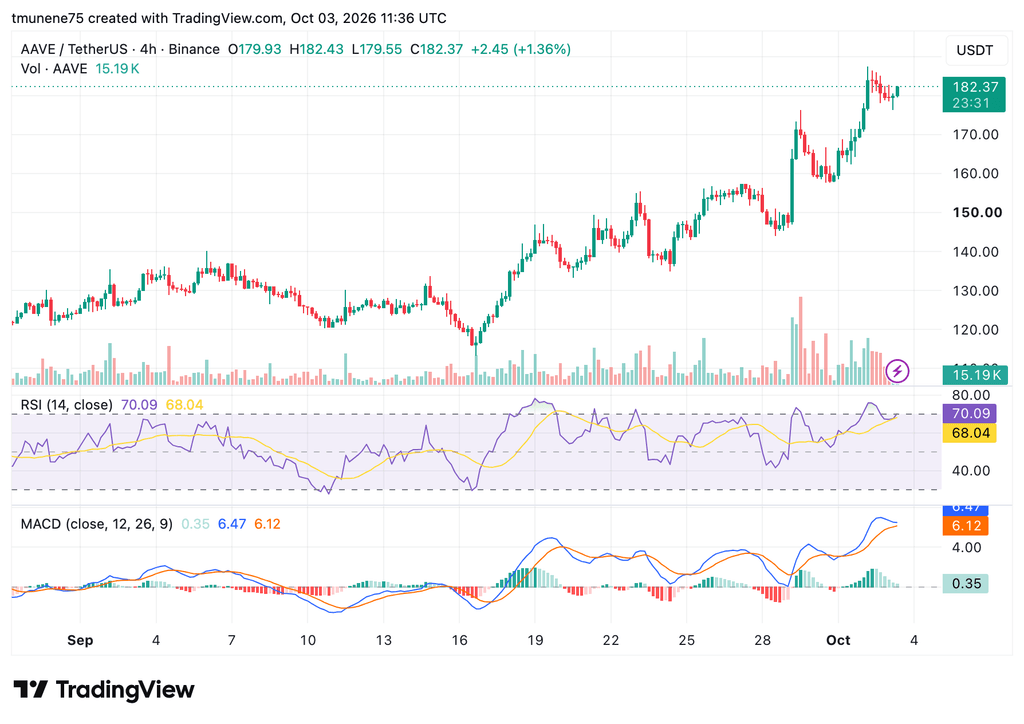
AAVE climbed from around 116-118 in mid-September to above $180, with 183-185 forming near-term resistance. AAVE’s RSI reached 70.09 while MACD remained positive, reflecting strong four-hour
- AAVE climbed from around 116-118 in mid-September to above $180, with 183-185 forming near-term resistance.
- AAVE’s RSI reached 70.09 while MACD remained positive, reflecting strong four-hour momentum near recent highs.
- Michael van de Poppe said AAVE could gain another 40% to 60% before the current move stalls.
AAVE has climbed above $180 after rebounding from mid-September lows, while analyst Michael van de Poppe sees more room. Van de Poppe said the token could gain another 40% to 60% before stalling. The four-hour AAVE/USDT chart showed higher highs, stronger momentum, and price holding near recent highs.
AAVE Price Moves Above $180
The rebound started after AAVE dropped to about 116-118 on September 16. Price then moved through $140, $150, $160, and $170 as buyers pushed the market higher. The latest move carried AAVE above $180, where trading has since stayed close to recent highs. Meanwhile, resistance sits around 183-185, followed by the $190 level.
On the other hand, $180 now marks the first support area. Below it, $170 remains the next support, while $160 marks a deeper level. The current structure therefore keeps attention on the area around $180.
RSI And MACD Show Strong Momentum
Momentum indicators also remain elevated on the four-hour chart. The RSI is at 70.09, above its moving average at 68.04 and near the 70 overbought threshold. However, that reading also leaves room for short-term consolidation or profit-taking.
Source:
TradingView
The MACD provides another measure of the current move. Its line sits at 6.47, above the 6.12 signal line, while the histogram reads 0.35. Therefore, the indicator remains positive as AAVE trades near its recent high. The combination of these readings places the latest price move alongside strong short-term momentum.
Van de Poppe Sees More Room Ahead
Van de Poppe described the chart as evidence that the market may be emerging from a bear market lasting more than four years. He also said the period produced few fundamental breakthroughs in technological development.
According to Van de Poppe, that picture has changed, with new developments now appearing. He said AAVE still has 40% to 60% potential before the move stalls. The analyst also said the broader bull market is getting started.
Meanwhile, a break above $185 could expose $190, while a drop below $180 could bring $170 into focus.