Analyst Sets $160 Solana Target as SOL Holds $115 Support
About 26 million SOL previously traded near $115, making the level a key support zone as ETF demand rises. U.S. spot Solana ETFs recorded 10 straight weeks of inflows, adding more than $360 m
A
AnonymousCryptoCompass newsroom
September 26, 2026
3 min read
NEWS
CryptoCompass editorial visual for altcoins coverage.
About 26 million SOL previously traded near $115, making the level a key support zone as ETF demand rises.
U.S. spot Solana ETFs recorded 10 straight weeks of inflows, adding more than $360 million to the products.
SOL remains above its 50-day and 200-day averages, while a break above 124-130 could put $160 in focus.
Solana analyst Ali Charts said SOL could target $160 if support near $115 holds and demand continues rising. His analysis points to 26 million SOL previously traded around $115, while U.S. spot Solana ETFs have recorded 10 straight weeks of net inflows. More than $360 million has entered those ETFs during that period.
ETF Inflows Strengthen Demand Around $115
According to Ali Charts, the $115 area carries added weight because 26 million SOL changed hands there. The level remains relevant as U.S. spot Solana ETF demand increases. The ETFs have posted 10 consecutive weeks of net inflows, with more than $360 million flowing into the products.
Meanwhile, more than 3 million SOL left exchanges over the past month. That decline reduced the amount of Solana readily available for sale. Exchange supply has continued falling as ETF demand has increased.
Network Activity Remains Elevated
Solana recorded 12.5 million new addresses on September 18, its highest level cited by the analyst. After that peak, Solana continued creating roughly 11 million new addresses per day. Ali Charts linked the network growth with the broader demand picture around SOL.
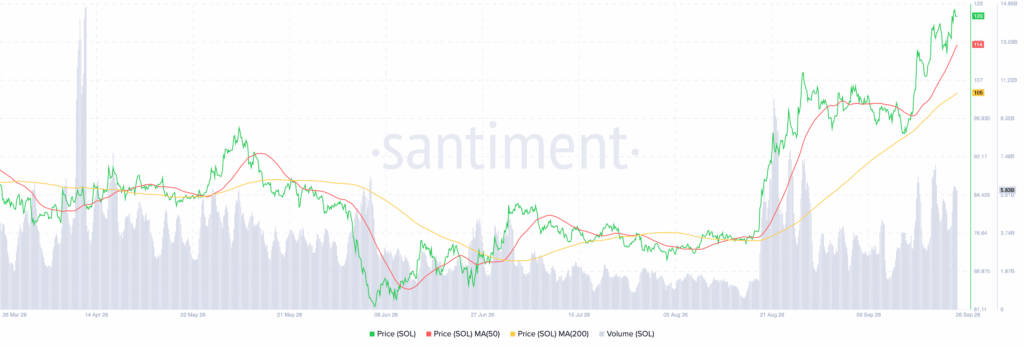
However, price still faces resistance between $124 and $130. The analyst said a break above that range could open a path toward $160 as resistance becomes thinner. The chart also shows SOL recovering from a June low near $61.11.
SOL reached approximately $120 by September 26 after falling from above $90 in May to around $61. The recovery accelerated from roughly $76 in August before SOL broke above $100.
SOL Holds Above Major Moving Averages
Recent candles have kept the sequence of higher highs and higher lows intact. Volume also expanded, with a recent reading near $5.83 billion. The 50-day moving average is around $114, above the 200-day average near $105.
SOL remains above both averages, making these key support references. The $114 area offers near-term support, while $105 represents deeper structural support. A move above $120 to $123 would place SOL near the chart’s upper boundary. However, rejection around that zone could send SOL toward $114, with $105 as deeper support.
BlockchainReporter and CoinTurk News EN both report Sequans finishing its Bitcoin treasury exit, but they give different figures for how much BTC was sold in the final transaction. Blockchain
You can also read this news on BH NEWS: XRP Ledger’s Latest Update Now Released The recent release of xrpld 3.4.1 marks a significant development for the XRP Ledger network. This updated vers
NEAR Protocol has jumped roughly 26% over the past week, with the token now trading near $4.90-$5.00 as Bitwise’s proposed NEAR ETF cleared one of its most important regulatory steps yet. The


 Source: