Why does a chart that's clearly recovering still leave traders unsure what to do next? That's the exact puzzle sitting behind the current ApeMars price prediction conversation. APRZ has climb
Why does a chart that's clearly recovering still leave traders unsure what to do next?
That's the exact puzzle sitting behind the current ApeMars price prediction conversation.
APRZ has climbed meaningfully off its recent lows, yet instead of a clean breakout, the token has settled into a flat, indecisive stretch right around a level that used to cap every rally attempt.
Zero net movement on the latest candle only adds to the confusion. Is this quiet consolidation before a real move or a stall that's about to reverse?
Before guessing at what comes next, it helps to actually break down what the chart is showing right now.
ApeMars Chart Analysis: Reading the Consolidation Zone
What makes the $APRZ chart analysis genuinely mixed is the location of that flat candle: it's sitting right at the upper edge of the Resistance-1 zone, the same box that previously required several attempts to reclaim during the recovery leg from deeper lows.
A breakout candle with real volume above this zone would be the clearest bullish confirmation available on the chart right now, while a slide back below the zone's lower boundary near $0.0002999 would suggest the recovery is losing steam rather than building toward Resistance-2 further up near $0.0003400.
Zero volume on the most recent candle means neither outcome has actually been confirmed yet; the chart is genuinely undecided, not quietly bullish or bearish, which is precisely why buyers appear hesitant to commit in either direction at this exact moment.
APRZ Listing: Where Things Stand Off the Chart
Separate from the technical picture, the APRZ listing situation has not changed: no centralized exchange listing has been officially confirmed by the project as of now.
APRZ continues trading exclusively through decentralized venues like Orca, meaning today's flat price action reflects thin, DEX-only liquidity rather than deep order-book demand.
ApeMars published tokenomics confirm a 70 billion total supply with a 50% presale allocation and a documented two-month staking lock on rewards specifically, not a broader supply-wide lock affecting overall circulating tokens.
Scheduled burns at Stages 6, 12, 18, and 23 remain the project's confirmed deflationary mechanism, continuing regardless of how the current consolidation resolves.
What's Confirmed Right NowStatusAPRZ trading exclusively on DEX venues (Orca)Confirmed70B total supply with 50% allocated to the presaleConfirmedStaking rewards locked for two months after launchConfirmedCentralized exchange (CEX) listingNot Yet ConfirmedApeMars Price Prediction: What the Chart Is Signaling
The current APRZ/SOL chart on Orca, viewed on the 4-hour timeframe, shows the token trading flat at $0.0003083, with the open, high, low, and close all printing at that exact same price and a 0.00% change on the candle, a rare, near-motionless print that reflects the current lull in trading.
Volume on this candle reads zero, reinforcing just how quiet activity has gotten. The 20-period EMA sits at $0.0003092, just above the current price, meaning short-term momentum remains a touch soft even after the broader recovery from deeper lows earlier in the chart.
This flatlining candle, sitting almost exactly at a former resistance test, is the technical detail creating the "mixed signal" read driving today's ApeMars Price Prediction debate.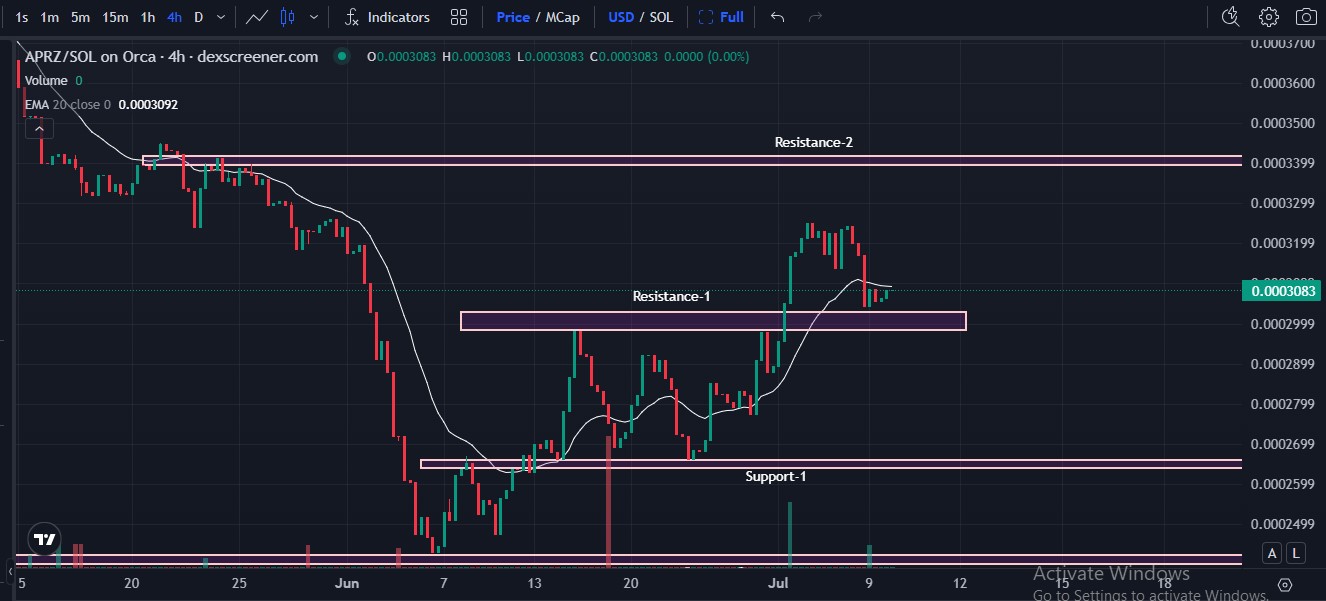
Source: Chart by Dexscreener
APRZ Technical LevelsValueCurrent Price (O/H/L/C)$0.0003083 (flat)Candle Change0.00%EMA 20 (Close)$0.0003092Resistance-2~$0.0003400Resistance-1 Zone~$0.0002999–$0.0003199Support-1~$0.0002599–$0.0002699ApeMars Price Prediction: Weighing the Breakout Scenarios
Every serious ApeMars price prediction right now really comes down to two clean scenarios built directly off the current chart.
A bullish ApeMars price prediction requires a confirmed close above the Resistance-1 zone with volume clearly returning above recent averages, opening the path toward a retest of Resistance-2 near $0.0003400.
A more cautious APRZ price prediction has to account for the flat, zero-volume candle currently sitting at resistance, since a failed breakout here has previously sent price back down toward support-1 near $0.0002599–$0.0002699.
The most balanced ApeMars price prediction simply treats this as a genuine coin-flip zone until volume actually returns and confirms a direction, rather than assuming the recent recovery guarantees a continued move higher.
Expert View: ApeMars Price Prediction and the Volume Problem
Analysts reviewing ApeMars note that the real issue isn't direction; it's conviction.
A flat, zero-volume candle sitting exactly at a former resistance test tells analysts that neither buyers nor sellers have committed yet, which is different from a confirmed rejection or a confirmed breakout.
The recommended approach is watching for the next candle with meaningful volume, rather than reading the current pause as a signal either way.
For verified project updates, including any future CEX listing news, the official ApeMars website and its X account remain the most reliable sources, since chart-based speculation alone can't confirm off-chain developments like an exchange listing.
Disclaimer
This article is for informational purposes only and does not constitute financial or investment advice. All ApeMars price prediction figures, resistance and support levels, and listing speculations mentioned are based on publicly available chart data and project statements and are not guaranteed outcomes. No official CEX listing has been confirmed at the time of writing. Cryptocurrency investments carry significant risk, including potential loss of capital. Always do your own research and verify information through official channels.