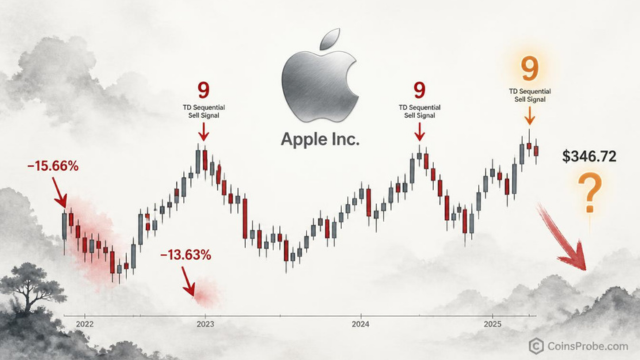
Key Highlights AAPL weekly chart prints TD Sequential sell '9' signal at $346.72 per @alicharts Prior two weekly sell signals preceded corrections of −15.66% and −13.63% respectively Channel
Key Highlights
AAPL weekly chart prints TD Sequential sell '9' signal at $346.72 per @alicharts
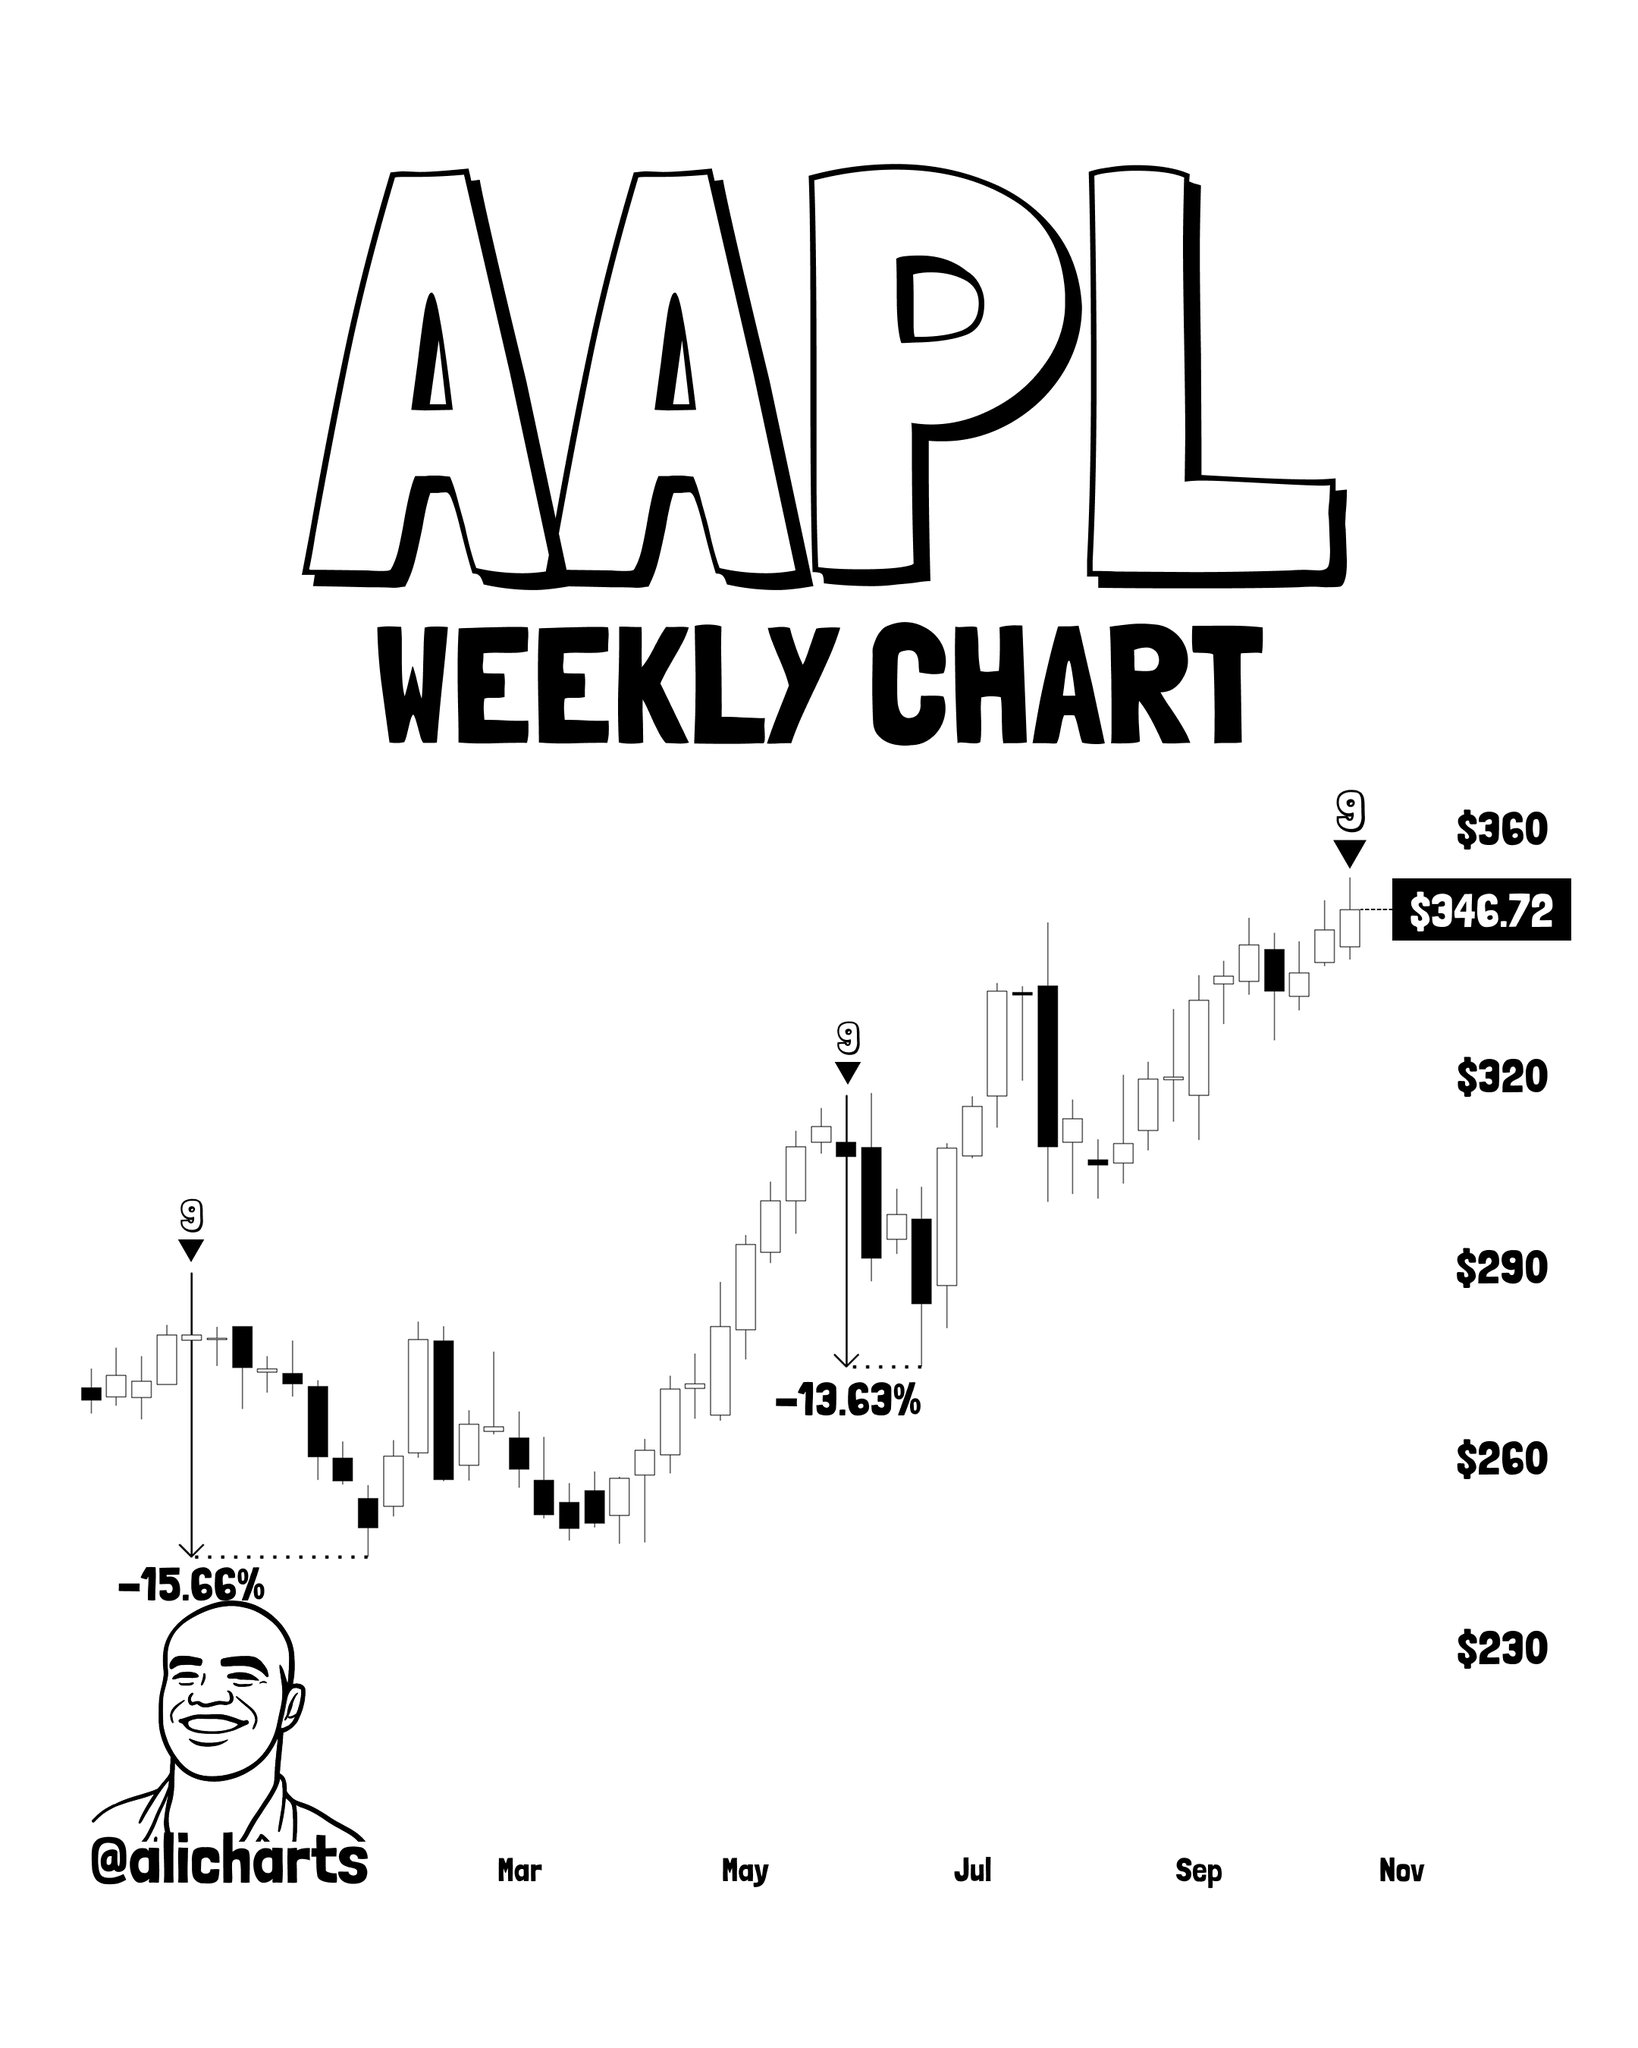
Prior two weekly sell signals preceded corrections of −15.66% and −13.63% respectively
Channel lower boundary at $339 is the first confirmation level; $332 is the failure target
Pattern status: still forming — no breakdown confirmed, price remains near recent highs
Apple Inc. ($AAPL) is trading at approximately $346.72 on the weekly chart — and a technical signal with a two-for-two track record of preceding double-digit corrections has just fired again. The TD Sequential has printed a sell “9” on the weekly timeframe, the same configuration that preceded pullbacks of 15.66% and 13.63% in its two most recent appearances.
The warning comes from analyst Ali Martinez (@alicharts), who flagged the setup on October 23, 2026, framing it directly: “APPLE BLOW-OFF TOP? The TD Sequential has flashed a sell signal on the weekly chart, suggesting $AAPL could be due for a retracement. This signal is worth paying attention to.” Martinez has tracked Apple’s technical structure closely, and the recurrence of this specific signal at elevated price levels warrants a precise breakdown of the mechanism and the prior track record.
The TD Sequential is a momentum exhaustion indicator developed by Tom DeMark. It does not identify a specific price level as resistance — it identifies the duration of a directional move. A sell “9” prints when price closes higher than the corresponding close four bars earlier for nine consecutive candles. On the weekly chart, that means nine straight weeks of relative upside momentum — a condition that historically marks not a reversal in itself, but a high-probability zone of exhaustion where buying pressure has become statistically extended.
The critical distinction: the TD Sequential is a non-directional momentum exhaustion signal. It does not predict magnitude or guarantee a reversal. What it does is identify conditions under which price has historically been vulnerable to mean-reversion. The signal becomes meaningful precisely because of its historical batting average — and in Apple’s case on the weekly timeframe, that record is two-for-two.
The weekly chart shared by @alicharts marks three TD Sequential sell “9” signals across the February–November timeframe. The first two are annotated with their confirmed outcomes — percentage declines that are historical facts, not projections. The third is the current signal, still forming.
AAPL Weekly Chart Analysis — @alicharts | Source: @alicharts (X)
Signal Instance
Signal Type
Correction Produced
Status
First weekly sell 9
TD Sequential Sell
−15.66%
Confirmed (historical)
Second weekly sell 9
TD Sequential Sell
−13.63%
Confirmed (historical)
Third weekly sell 9
TD Sequential Sell
TBD
Signal active, no breakdown confirmed
Source: @alicharts (X), Apple Weekly Chart — October 2026
The average correction across the two prior instances is approximately 14.6%. Applied mechanically from the current chart price of $346.72, that would imply a hypothetical retracement zone — but the TD Sequential does not generate price targets. The historical percentages are data observations, not forward projections, and Martinez does not attach a target to this signal.
In a prior post on October 22, 2026 (ID: 2113283856723779630), which Martinez’s October 23 post quotes for channel context, he identified a rejection at $347 as a structural reference. The channel’s lower boundary sits at $339, which becomes the immediate focus if selling pressure materializes. A failure to hold $339 would shift attention to $332 as the next structural level. These levels are drawn from Martinez’s channel analysis and represent the price architecture framing the current TD Sequential signal.
Apple’s concentration in equity indices adds a macro dimension worth noting here. As covered previously, Nvidia and Apple together represent 15% of the S&P 500 — a concentration that surpassed the 1999 dot-com peak. A double-digit correction in AAPL at these weights is not isolated stock risk — it carries index-level implications. Separately, the degree to which 10 stocks have driven 70% of the S&P 500’s gains since March 30 means any rotation out of mega-cap names would be felt broadly.
What it says: Apple’s weekly chart has printed a TD Sequential sell 9 at $346.72 — a momentum exhaustion condition that preceded corrections of 15.66% and 13.63% in its two most recent weekly occurrences. The signal is active.
What it doesn’t say: It does not confirm a reversal has begun. No breakdown has occurred. The pattern status is still forming — price remains near recent highs. The TD Sequential flags exhaustion zones; price can extend further before resolving, and not every sell 9 produces a correction of comparable magnitude.
What to watch for confirmation: A weekly close below $339 — the channel lower boundary Martinez identifies — would be the first structural confirmation that the sell signal is being validated. Loss of $332 would confirm a deeper correction is underway.
Bullish Scenario — Signal Fails, Extension Continues
If AAPL holds above $347 on a weekly closing basis and the TD Sequential signal is absorbed without a directional breakdown, the pattern fails to confirm. In prior cycles where sell 9 signals have not preceded meaningful corrections, price has often ground higher as bulls exhausted the residual selling pressure. No specific upside target is warranted by the current data.
Bearish Scenario — Channel Breakdown Confirms the Signal
A weekly close below $339 opens the path toward $332, the failure level Martinez identified in his October 22 channel analysis. Applying the average of the two prior TD Sequential corrections (−14.6%) from the $346.72 chart price produces a hypothetical zone near $296 — but this is a mechanical observation, not a stated target, and the analyst has not assigned a correction magnitude to the current signal.
Apple’s technical setup at $346.72 is a two-for-two warning with an unresolved outcome. The sell “9” is printed. The channel rejection at $347 is documented. The prior corrections of 15.66% and 13.63% are on record. What remains is price confirmation — and that answer arrives at $339 on a weekly closing basis.
Disclaimer: The views and analysis presented in this article are for informational purposes only and reflect the author’s perspective, not financial advice. Technical patterns and indicators discussed are subject to market volatility and may or may not yield the anticipated results. Investors are advised to exercise caution, conduct independent research, and make decisions aligned with their individual risk tolerance.
Also Read: Gold’s Head and Shoulders Tests Neckline — $4,000 in Focus If Support Breaks