BlockDAG PricePrediction today sets aside the earlier launch-delay and $0.5 recovery narratives this coverage has tracked, and looks instead at what's directly in front of BDAG: a fall to $0.
BlockDAG PricePrediction today sets aside the earlier launch-delay and $0.5 recovery narratives this coverage has tracked, and looks instead at what's directly in front of BDAG: a fall to $0.00001467, down 8.51%, sitting just above a support level it's now testing closely.
BDAG Is Now Just 1.57% Above Its Nearest Marked Support
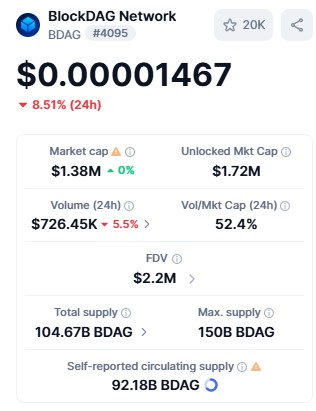
Source: BDAG live stats dashboard, captured September 19, 2026
This is the most immediate technical fact worth leading with. BDAG's closest chart support sits at $0.00001444, and today's $0.00001467 is only about 1.57% above it, the closest this coverage has trackedBDAG to a marked support level.
That does not mean a break is imminent, but it does mean the margin for further decline before testing genuinely unmarked territory is thin.
What Happens If $0.00001444 Breaks?
Since the chart does not mark a support level below $0.00001444, any move past it would be moving into territory without a prior technical reference point on this chart.
Rather than guessing at a specific target, it's more useful to lay out what different magnitudes of further decline would actually look like in price terms.
Decline From $0.00001467
Resulting Price
-10%
$0.00001320
-20%
$0.00001174
-30%
$0.00001027
-50%
$0.00000734
These are hypothetical reference points for understanding scale, not targets or forecasts.
Same Elevated Turnover, Still a Warning Sign
Today's Vol/Mkt Cap ratio sits at 52.4%, continuing the same elevated pattern flagged in the prior update (then 52.08%).
Daily volume equal to roughly half of BDAG's entire market cap remains more consistent with speculative, unstable trading than steady, confidence-driven accumulation, worth keeping in mind alongside today's price move.
Chart Levels Above Current Price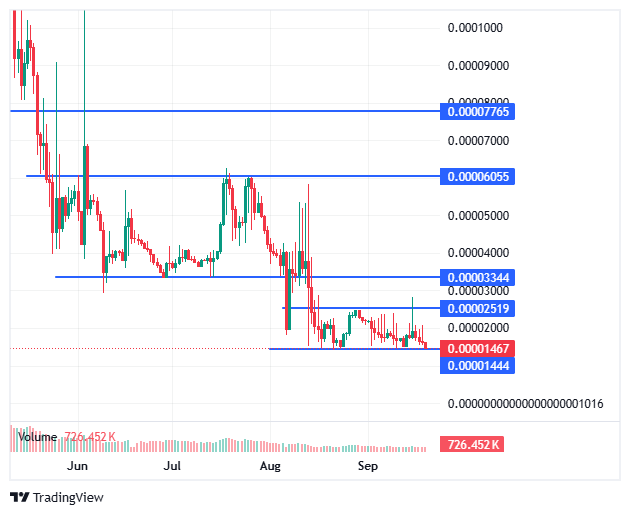
Source: BDAG price chart, captured September 19, 2026
Level
Price
Multiple From $0.00001467
Resistance
$0.00007765
5.29x
Resistance
$0.00006055
4.13x
Resistance
$0.00003344
2.28x
Resistance (closest)
$0.00002519
1.72x
Current Price
$0.00001467
—
Support (closest)
$0.00001444
—
What Would It Take for A Real Bounce?
A genuine reversal, as opposed to a brief technical rebound, would need volume to shift meaningfully away from today's elevated-but-unstable pattern toward sustained, steadier buying, ideally accompanied by $BDAG holding above $0.00001444 rather than briefly dipping below it.
Clearing the nearest resistance at $0.00002519 would be the first confirming signal, still well short of anything involving the $0.5 scenarios covered in earlier updates, which remain separate, far larger, and unconfirmed questions.
BDAG Price Prediction: Near-Term Scenarios
BlockDAG Price Prediction points to a bear case of $0.00001027–$0.00001444, a base case of $0.00001444–$0.00001700, and a bull case of $0.00001700–$0.00002519, anchored to today's price and chart levels.
Scenario
$BDAG Price Range
Key Driver
Invalidation
Bear Case
$0.00001027–$0.00001444
The nearest support breaks under continued selling, moving into unmarked chart territory
A sustained close back above $0.00001444 counters this
Base Case
$0.00001444–$0.00001700
Price holds near current levels without a decisive break either way
Price falling below $0.00001444 and holding
Bull Case
$0.00001700–$0.00002519
A shift toward steadier, sustained volume clears the closest resistance
Requires the elevated Vol/Mkt Cap pattern to shift from unstable to sustained buying
Disclaimer
Informational purposes only, not financial advice. $BDAG trades at $0.00001467, down 8.51%, sitting about 1.57% above its nearest marked chart support. No lower support is shown below that level. Market cap is self-reported and flagged; circulating supply is not independently audited. This update focuses on near-term technical conditions and does not address BlockDAG's broader launch timeline or any long-term recovery scenario. Price predictions are pattern-based estimates, not guaranteed outcomes. Cryptocurrency carries significant risk of loss.
