$CAP is currently sitting at $0.05213, up almost 34% today. Not bad for a token that's barely a month old. CAP only hit major exchanges back in July 2026, and the debut alone dragged in close
$CAP is currently sitting at $0.05213, up almost 34% today. Not bad for a token that's barely a month old.
CAP only hit major exchanges back in July 2026, and the debut alone dragged in close to $900 million in volume over the first ten days, so demand clearly wasn't shy right from day one.
Now here it is, weeks later, knocking on levels it's genuinely never traded at before.
If you're searching for a cap price prediction right now, you're basically asking one thing: does this rally still have legs, or is it due for a breather?
Getting this close to a fresh high always pulls two crowds at once, buyers chasing the move and sellers ready to cash out.
Live CAP Price Data
Cap is currently sitting at $0.05213, up roughly 33.9% in a day.
That's not a small candle by any measure, and the 24-hour range makes it obvious, from $0.03756 up to $0.05233. 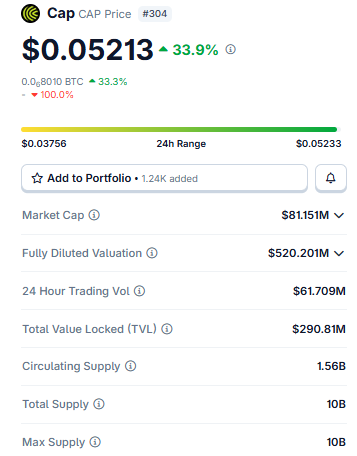
Source: $CAP market cap data taken from Coingecko, data as of Aug 10, 2026. Figures may vary slightly across other tracking websites.
The market cap is near $81.151 million right now. Fully diluted valuation, though, tells a bigger story at about $520. 201 million, a gap explained by the 10 billion max supply against just 1.56 billion currently circulating.
Total value locked comes in at $290.81 million, worth flagging given how young this token still is. Daily volume landed around $61.709 million.
For a cap price prediction made this early in a project's life, that TVL number arguably matters as much as the chart itself.
Liquidation Data and Exchange Volume
The script flipped over the last day. $429.95K in total liquidations, and this time it's shorts eating nearly all of it, $370.64K worth, against just $59.32K on longs. 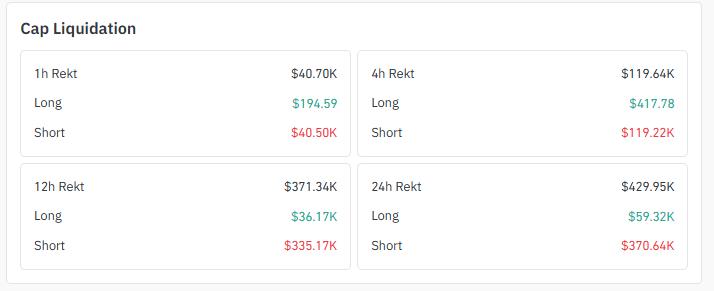
Source: Liquidation Data Taken From Coinglass.
The same pattern shows up in the 12-hour window too: $371.34K total, with shorts absorbing most of it again.
Even the tighter 1-hour and 4-hour windows echo the same thing, with shorts getting squeezed as price kept grinding up.
That's just what happens when a rally catches traders leaning the wrong direction.
Volume's concentrated too, and heavily so. OKX leads by a mile at $70.70 million, Binance trailing at $39.89 million. 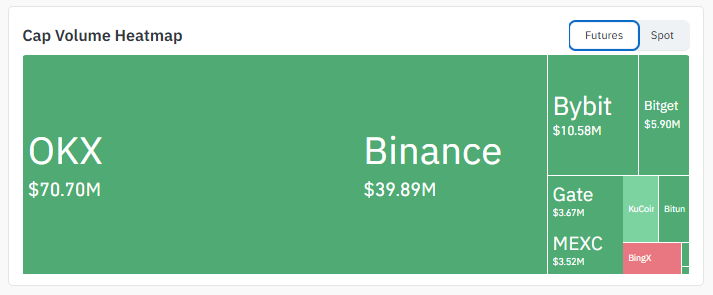
Source: Heatmap Data Taken From Coinglass.
Bybit picks up $10.58 million after that, with smaller slices scattered across Bitget, Gate, MEXC, KuCoin, and BingX.
Key Takeaways
Nearly 34% up today, price at $0.05213, sitting right below a fresh all-time high
That rounded base on the 4H chart? Held up better than expected under this climb
Shorts are the ones bleeding this time, with longs mostly untouched, a flip from the usual script
OKX is out-trading nearly every other exchange combined right now
Break the current high, and the next real level isn't a normal resistance line; it's a Fib extension
Technical Analysis: 4-Hour Chart Analysis for Cap Price Prediction
$CAP spent a while building out a rounded base, and the price hasn't looked back since breaking out of it. Now it's staring right at its previous all-time high near $0.062969.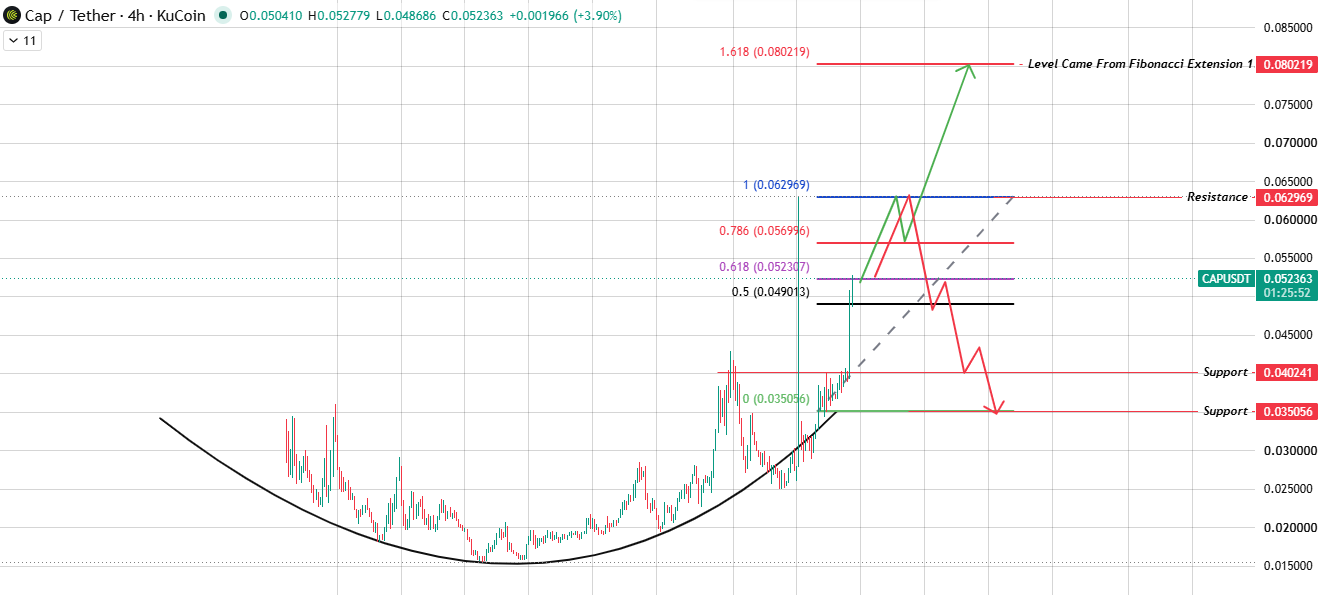 Source: Chart Taken From TradingView.
Here's the catch with fresh highs is that once the price actually clears one, there's no old resistance left to measure against, so traders fall back on Fibonacci extensions instead.
The 1.618 extension here lands at $0.080219, and that becomes the level if this move has legs.
Get rejected at that high instead, and the price likely drifts back toward support at $0.040241, with $0.035056 waiting underneath that.
Bull, Base, and Bear Case
ScenarioPrice LevelTrigger ConditionInvalidation Level
Bull Case$0.062969 – $0.080219Breaks above prior all-time high, extends toward Fib 1.618Falls back below $0.049013
Base Case$0.049 – $0.056Price consolidates below all-time high resistanceSustained close outside either boundary
Bear Case$0.040241 – $0.035056Gets rejected at resistance and breaks 4H supportReclaims above $0.062969
Long-Term Outlook
Everything from here depends on whether $CAP can actually clear that old high and hold above it.
Manage that, especially with volume staying solid across OKX and Binance, and the broader cap price prediction leans more bullish toward those extension levels.
Fail to clear it, though, and some consolidation or a dip back toward the rounded base support looks more likely.
This token's still young enough that sharp moves in either direction shouldn't surprise anyone for a while.
Glossary
Ever seen a chart that looks like a bowl? That's a rounded base, a gradual pattern that often points to accumulation before a bigger move up.
Fibonacci extensions, the 1.618 level used here included, project where price might head once it's already broken past a prior high and there's nothing old left to reference.
Think of aliquidation as a forced exit, an exchange closing out a leveraged position because the trader simply can't cover the losses anymore.
TVL, or Total Value Locked, tracks the total value sitting inside a protocol at any given moment, whether deposited or staked.
And ATH? Just shorthand for all-time high, the highest price a token's ever touched since it started trading.
Methodology
This cap price prediction leans on TradingView chart readings from the 4-hour timeframe, paired with liquidation and volume figures pulled from Coinglass.
Fibonacci extensions only come into play once a price nears or breaks a prior all-time high, since there's no historical resistance left to lean on at that point.
Every level here reflects current chart structure, not guesswork, though given how early this token still is, things can shift fast.
Disclaimer: This article is for informational purposes only and does not constitute financial advice. Cryptocurrency markets are highly volatile, and past price behavior does not guarantee future results. Always conduct independent research before making investment decisions.