Cash Cat has gone from a sleepy small-cap to one of the loudest names in crypto this week. $CASHCAT is up more than 100% over the past 7 days, even after pulling back over 8% today. A major e
Cash Cat has gone from a sleepy small-cap to one of the loudest names in crypto this week.
$CASHCAT is up more than 100% over the past 7 days, even after pulling back over 8% today.
A major exchange listing has thrown fuel on the fire, and now traders are trying to figure out if this move still has room to run.
This Cash Cat price prediction breaks down what's driving the rally, what futures traders are doing, and the levels that matter next.
Why Is Cash Cat's Price Cooling Off Today?
$CASHCAT is currently trading at $0.1001, down 8.15% over the last 24 hours, a pullback after a massive run.
Market cap sits at $100.14M, with the token's fully diluted valuation matching it exactly since the full 1B $CASHCAT supply is already circulating.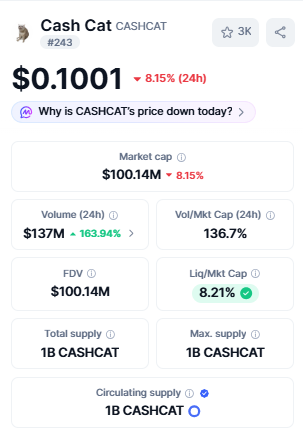
Volume tells the real story here: 24-hour trading volume has exploded 163.94% to $137M, pushing the Volume/Market Cap ratio to an extreme 136.7% meaning trading volume is actually higher than the entire market cap.
Liquidity/Market Cap sits at a healthy 8.21%, suggesting the token isn't as thin as its size might suggest.
That volume spike is central to today's Cash Cat price prediction, since it signals real participation rather than a thin, low-liquidity move.
Data source: coinmarketcap
What's Behind Cash Cat's Sudden Spotlight?
Robinhood has added CASHCAT as a new tradable asset on its app and on Robinhood Legend, opening the token up to a massive retail trading audience.
Listings like this tend to draw a wave of fresh buyers, and today's surge in volume lines up closely with exactly that kind of attention.
What Are Futures Traders Doing With CASHCAT?
Liquidation data shows a clear shift over the past 24 hours: $2.93M in positions were wiped out, almost evenly split between $1.43M in long positions and $1.50M in shorts, a sign that both sides got caught off guard by the volatility.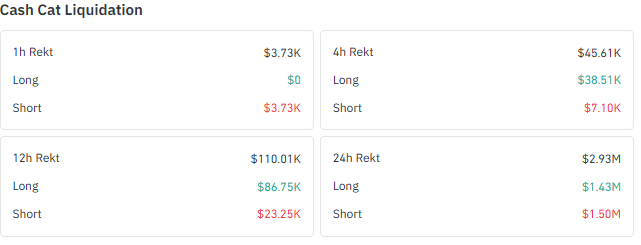
The shorter windows tell a different story: over the past 4 hours, $45.61K was liquidated with longs taking the bigger hit at $38.51K versus $7.10K in shorts, while the last hour saw liquidations entirely on the short side at $3.73K.
That flip suggests today's pullback is now squeezing recent shorts more than longs.
Open interest has climbed sharply too, reaching $19.21M up from lows near $3M in late July, tracking closely with $CASHCAT's price surge.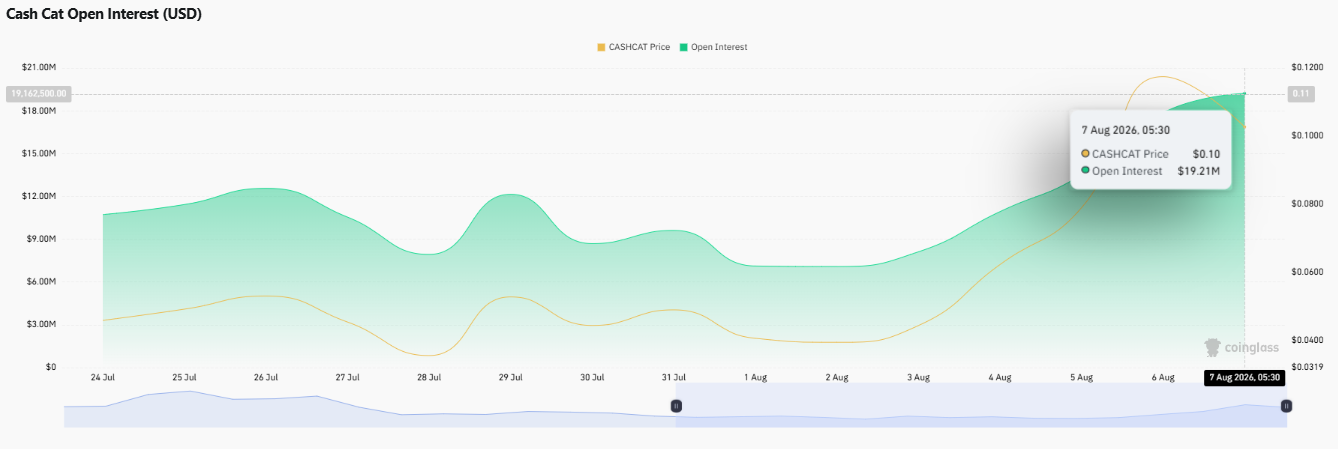
Rising OI alongside rising price typically points to fresh money entering the market rather than just short covering.
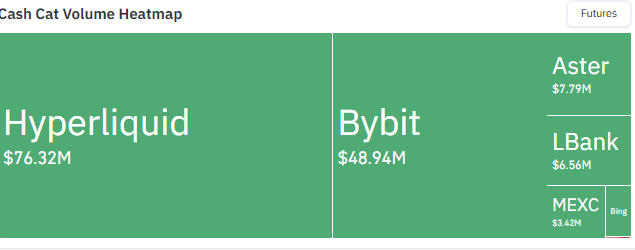
Trading activity is concentrated on Hyperliquid ($76.32M) and Bybit ($48.94M), with smaller volumes spread across Aster, LBank, and MEXC.
Data source: coinglass
Has Cash Cat Flipped Its Downtrend Into an Uptrend?
The TradingView data shows Cash Cat spent late July grinding lower inside a descending channel, but that structure gave way to a sharp breakout in early August, fueled by the volume surge noted above.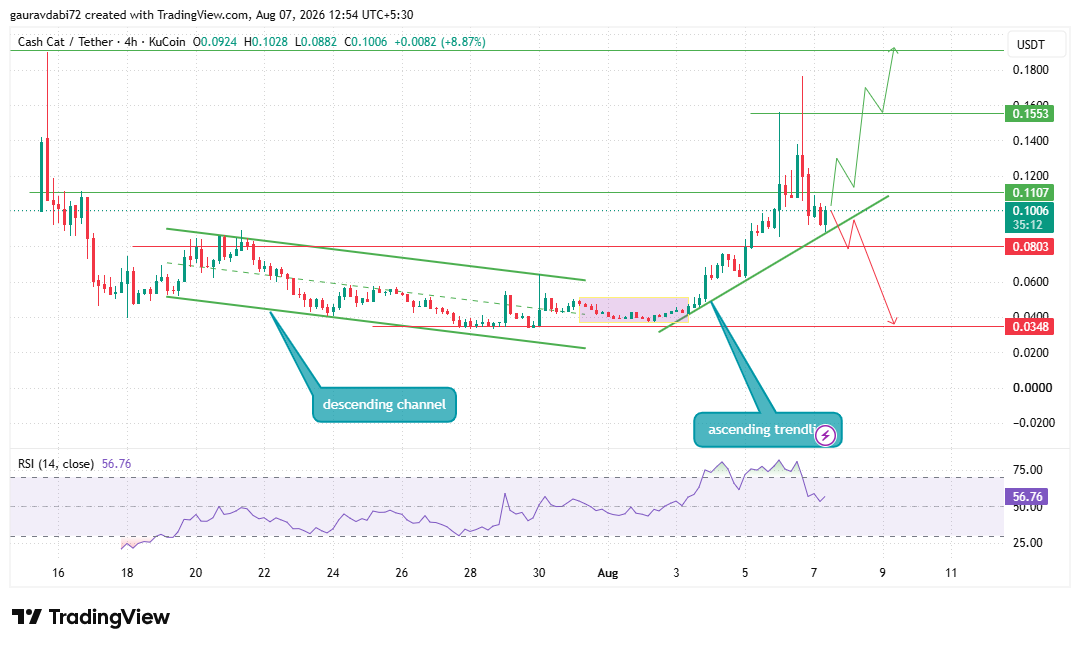
Since then, price has been carving out a fresh ascending trendline, a shift in market structure that favors buyers as long as it holds and gets confirmed on a daily close rather than an intraday spike.
$0.1107 is the first resistance to watch, with a stronger ceiling at $0.1553 above that.
On the downside, a retest of the breakout zone near $0.0803 is the level buyers need to defend; a deeper move below that exposes $0.0348.
The 14-day RSI sits at 56.76 — comfortably in neutral-to-bullish territory, with no sign yet of the overbought extremes that would normally warn of exhaustion.
Where Could Cash Cat Head From Here?
Scenario
Key Levels
Bullish Scenario
Holding the ascending trendline and reclaiming $0.1107 opens the door toward $0.1553.
Neutral Scenario
$CASHCAT consolidates between $0.0803 and $0.1107 as the market digests recent gains.
Bearish Scenario
A confirmed break below $0.0803 shifts focus toward the deeper support at $0.0348.
Just How Big Has Cash Cat's Rally Been?
The scale of this move becomes clear when zooming out. CASHCAT is up 6.59%over the last 4 hours and a massive 107.26% over the past 7 days, despite today's pullback.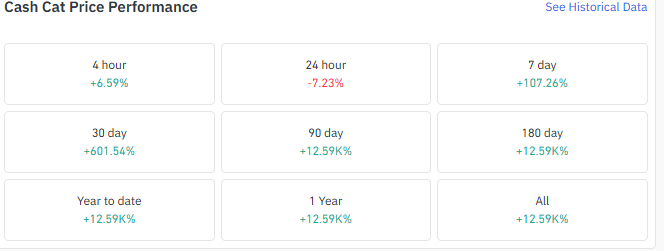
Looking further back, the token is up 601.54% over 30 days, and across the 90-day, 180-day, year-to-date, 1-year, and all-time windows, gains all sit above 12,590%, reflecting just how far $Cash Cat has climbed from its earlier base.
Data source: coinglass
What's Next for Cash Cat?
As per the Coingabbar analysts, Cash Cat's pullback is a natural pause after an exceptionally sharp rally rather than a sign of trend failure.
The shift in liquidations from broad long-side pain in the shorter windows to short-side squeezes appearing more recently points to two-sided volatility as the market tries to find fair value after the Robinhood-driven surge.
Rising open interest alongside the price gains suggests new capital is still entering rather than the move being purely short-covering.
Most analysts would treat the current cooldown as consolidation within a young uptrend, with the broader Cash Cat price prediction staying constructive unless the recent structure breaks down.
Disclaimer: This article is for informational purposes only and should not be considered financial or investment advice. Cryptocurrency markets are highly volatile; always conduct your own research before making any trading decisions.
