Is Chainlink about to break the $11.98 ceiling that stopped its last bounce? The latest Chainlink price prediction leans bullish, with a condition attached. At 09:20 UTC on Nov 5, 2026, the L
Is Chainlink about to break the $11.98 ceiling that stopped its last bounce?
The latest Chainlink price prediction leans bullish, with a condition attached. At 09:20 UTC on Nov 5, 2026, the LINK price trades at $11.55, up 5.51% in 24 hours.
TheNovember price outlook covers the wider range.
LINK Price Snapshot at 09:20 UTC
CoinMarketCap data ranks Chainlink 13th, with a $8.64B market cap and $392.39M in spot volume, up 39.11%.
The 24-hour range ran from $10.91 to $11.75, and supply sits at 748.09M LINK out of a 1B max.
Price still trails the $52.88 peak from May 10, 2021 by 78.09%.
But zoom out and the picture turns mixed, with -1.95% over 7 days, -16.57% over 30 days, and +41.39% over 90 days.
Why Is LINK Moving Today?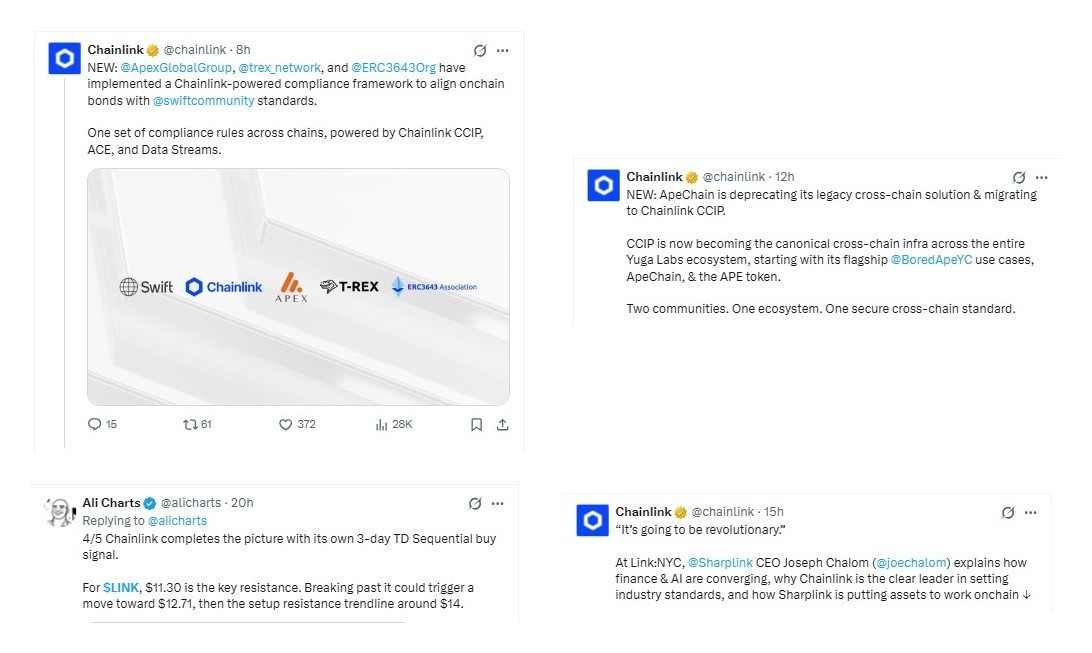
Breaking. ApeChain is dropping its legacy bridge.
ApeChain's CCIP migration makes Chainlink's cross-chain protocol the standard rail across the Yuga Labs ecosystem, starting with the APE token.
It landed about 12 hours before the 09:20 UTC snapshot, right around a vertical jump from $11.0 to $11.7 on the 24-hour chart.
Swift news landed too. Apex Group, T-REX Network, and the ERC3643 Association rolled out a Chainlink-powered compliance framework for on-chain bonds.
Ali Charts flagged a 3-day TD Sequential buy signal, a counting tool that spots tired selling. Price has cleared his $11.30 hurdle, and $12.71 comes next.
Sharplink CEO Joseph Chalom called finance and AI convergence revolutionary at Link:NYC.
LINK Technical Analysis: How October Built This Ceiling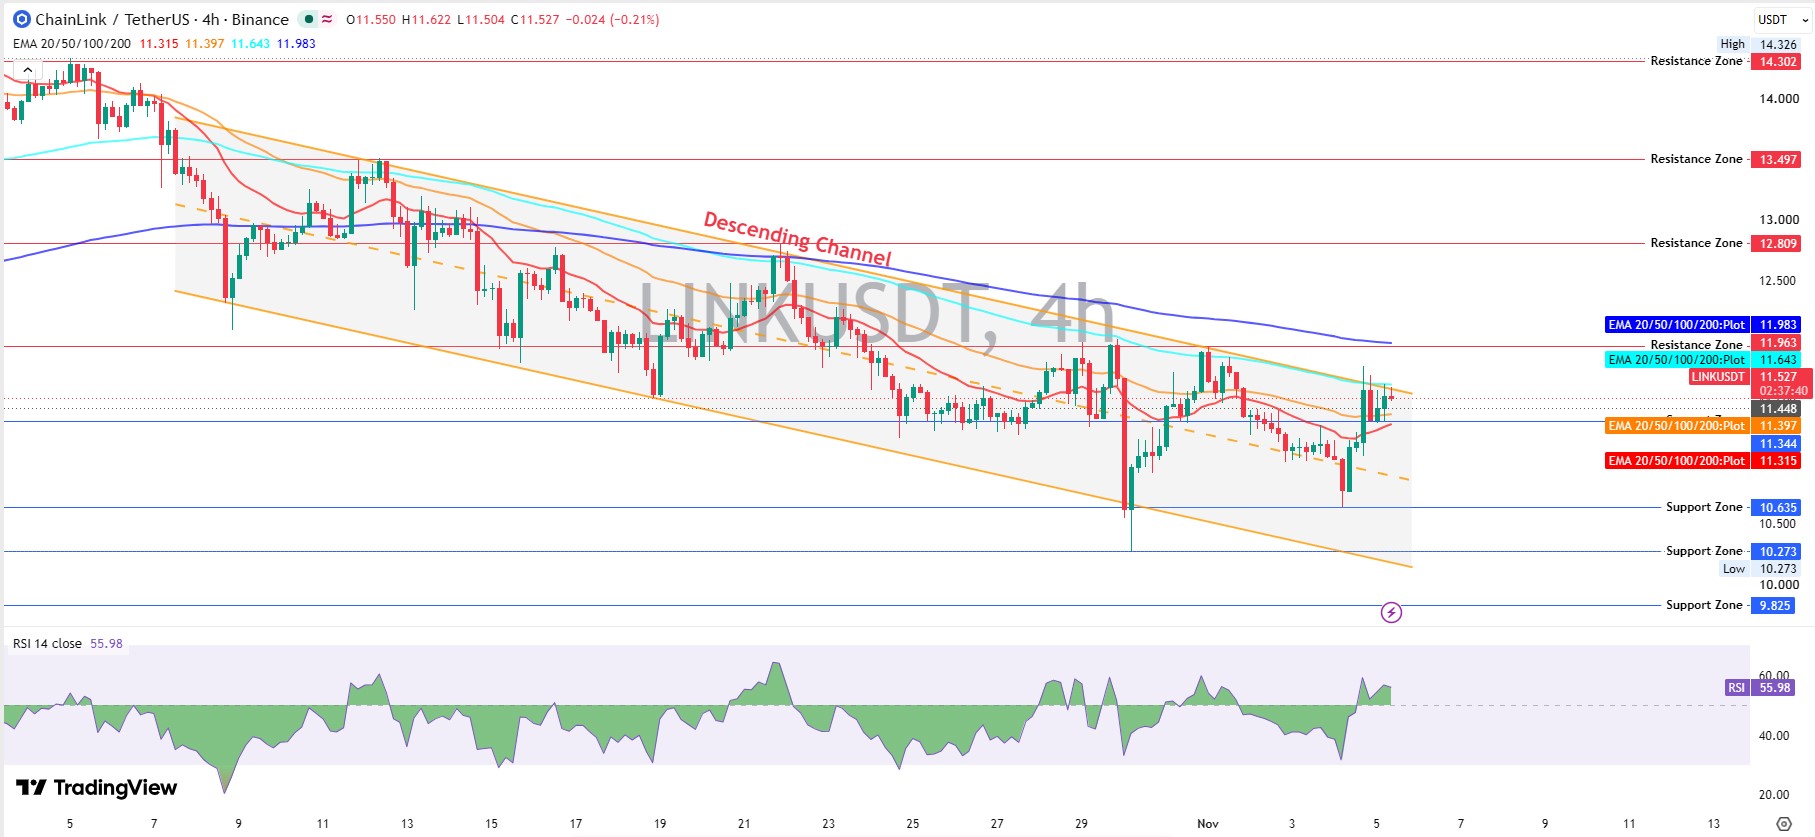
Early October opened near $14.33, the chart's high. Sellers took control, and every bounce since has topped out lower.
That pattern carved a descending channel, a falling lane through lower highs and lower lows, on the TradingView LINKUSDT chart.
A hard flush came on Oct 9. Buyers rebuilt toward $13.50 by Oct 12. And nothing has traded that high since.
Another lower high formed near $12.81 on Oct 22, then a violent wick hit $10.27 on Oct 30.
Buyers answered fast. By Nov 1, the price had climbed back to $11.96, but the 200 EMA, a long-term average of past prices, sat at $11.98. Rejection.
Nov 3 and Nov 4 handed the gains back, dipping toward the $10.635 support level. Then the turn.
A strong 4-hour push reclaimed the 20 EMA and 50 EMA, now at $11.315 and $11.397.
RSI reads 55.98. Above the midpoint, far from overheated.
Price now leans on the upper channel line, and the whole Chainlink price prediction hinges on what happens there.
This LINK technical analysis needs a single thing. A 4-hour candle above $11.98.
Support Levels Below $11.55
Chainlink support and resistance levels start with floors. The nearest sits at $11.448, then $11.344, with the 20 EMA at $11.315 below.
A slip under $11.30 erases the buy-signal level. Deeper floors are $10.635, $10.273, and $9.825, and the earlieroversold breakdown setup offers a comparison.
Resistance Levels: Two Gates and a Ladder
Gate 1 is the 100 EMA at $11.643, just $0.11 above the spot. Next comes Gate 2, which stacks $11.963 resistance on the 200 EMA at $11.983.
And above that, the ladder runs $12.809, $13.497, and $14.302. The October$12.47 channel breakout shows where earlier attempts stalled.
Derivatives Traders Lean Long
CoinGlass LINK data shows $734.80M in futures volume against $117.91M in spot, with open interest, money sitting in open contracts, at $556.78M.
Long-to-short account ratios read 1.8752 on Binance and 2.06 on OKX.
Liquidations, forced exits from leveraged bets, totaled $980.81K in 24 hours, with $841.00K hitting shorts.
That sounds bullish. Scratch that, because $980.81K is tiny beside $556.78M of open interest. Call it mild relief.
Spot ETF Funds Add Nothing New
SoSoValue ETF data shows $0.00 net inflow as of Nov 4, with cumulative inflow at $177.46M and net assets at $200.35M.
Funds aren't buying. But they aren't selling either.
Whale Wallets Hold the Real Vote
Etherscan holder data counts 915,588 holders. But 4,077 whale wallets hold 90.52% of the market cap tier, and many are Chainlink's own noncirculating wallets, so that isn't automatic selling.
Who actually sells for $11.98 when supply is held this tightly?
Chainlink Price Prediction Scenarios and Targets
Bullish bias holds while $11.30 stands. Targets assume 4-hour candles, not wicks.
Scenario
Trigger
Target
Invalidation
Liquidity Condition
Bull
4-hour candle above $11.983
$12.809, then $13.497
Back under $11.643
Volume above $392.39M, shorts liquidated
Base
Range of $11.344 to $11.983
Same range
Candle outside either edge
Volume near $392.39M, ETF flow at $0
Bear
Trades under $11.30
$10.635, then $10.273
Reclaims $11.643
Thin volume, longs liquidated
Chainlink Price Prediction: Bull Case
Bulls need a 4-hour candle above $11.983 backed by volume over $392.39M. And that opens $12.809, the Oct 22 lower high.
ThePolymarket channel test adds earlier context.
Base Case: Range Between the Gates
Neither side holds a volume edge, so a chop between $11.344 and $11.983 is the likeliest path.
For comparison, see the earlierAPAC floor test.
Bear Case: Floors Reopen
Trading under $11.30 points to $10.635, then the $10.273 wick from Oct 30. Sellers have a simple job. Defend $11.963.
More context sits in theNovember market dip analysis.
Risks That Could Change the Setup
A second rejection at $11.983 would confirm the lane. The 30-day drop of 16.57% already shows the larger trend pointing down.
Fresh ETF inflows would strengthen this Chainlink price prediction, and holder selling, covered in thewhale holder channel study, would weaken it.
Disclaimer: This Chainlink price prediction is for information only and isn't financial advice. Crypto prices swing fast, and scenarios aren't guarantees. Research independently before any trade.