Not much drama here, just $8.26 and a small gain on the day. Market cap sits close to $6.2 billion, enough to keep Chainlink comfortably inside the top 20 by size. It's had a rough stretch co
Not much drama here, just $8.26 and a small gain on the day. Market cap sits close to $6.2 billion, enough to keep Chainlink comfortably inside the top 20 by size.
It's had a rough stretch compared to its highs, sure, but the oracle network keeps expanding its real-world partnerships.
That's usually what gets interest spiking again, new integrations landing while the price itself just sits there, waiting.
Live Market Data
$LINK trades at $8.26, up 0.5% over the past 24 hours, the anchor for this Chainlink price prediction. Day's range: $8.16 to $8.31. 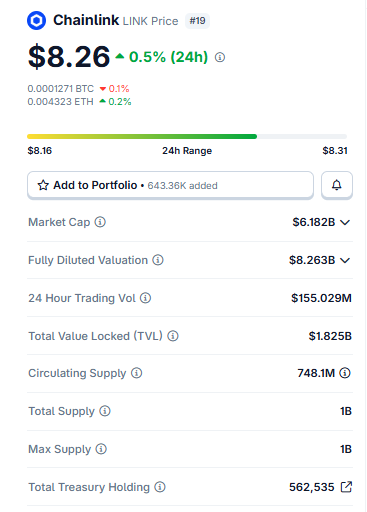
Source: Chainlink market cap data taken from Coingecko, data as of Aug 08, 2026. Figures may vary slightly across other tracking websites.
Market cap holds near $6.182 billion, with a fully diluted valuation around $8.263 billion. Volume over 24 hours came in at $155.029 million, with a total value locked across the network at $1.825 billion.
The circulating supply sits at 748.1 million tokens against a 1 billion total and max supply.
Liquidation Data
Shorts have been eating the losses lately. One hour: $20.24 gone, all from shorts.
Four hours: $1.79K total, $1.28K longs against $509.95 shorts, and longs actually ahead there. 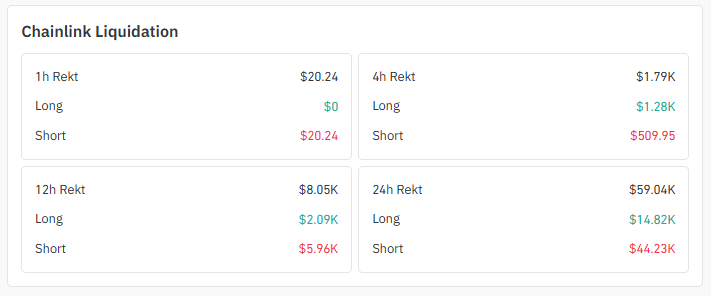
Source: Liquidation Data Taken From Coinglass.
Twelve hours flips it back, $8.05K total with shorts leading at $5.96K. Zoom out to a full day, though, and shorts pull well ahead, $44.23K against $14.82K in longs, $59.04K total.
Exchange Volume of $LINK
Binance dominates $LINK futures, with $69.91M in volume and nothing else close. 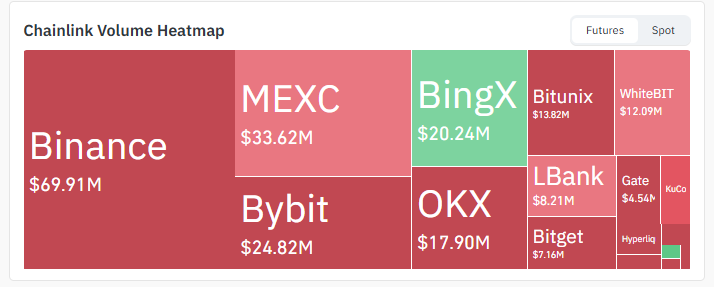
Source: Volume Heatmap Data Taken From Coinglass.
MEXC sits second at $33.62M, Bybit third at $24.82M, and OKX trails at $17.90M, with BingX, Bitunix, and WhiteBIT filling out a decent tail below that.
Social Sentiment of $LINK
Word going around: a fresh integration just brought Chainlink's US equities data feeds live on another major network, aimed at powering equity-focused DeFi products with round-the-clock data. 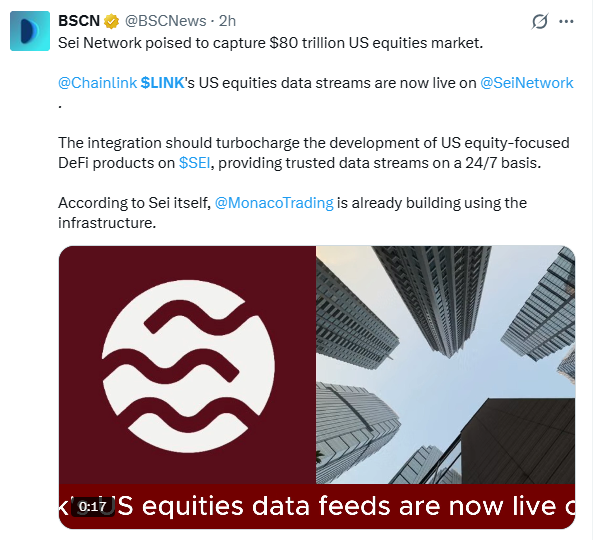
Source: Data Taken From @BSCNews, X Account.
At least one trading platform is already reportedly building on top of it.
Real-world data partnerships like this keep extending Chainlink's footprint, quietly, deal by deal.
Key Takeaways
$8.26. That's LINK right now, up 0.5% on the day, the base for this Chainlink price prediction.
A triangle on the daily chart, price converging toward a decision point.
Upper boundary breaks with volume? $9.849 opens up, then $10.870.
Break down instead, and $7.643 comes into range fast, $6.996 not far behind.
Shorts took the bigger liquidation hit lately, with $44.23K gone over the past day alone.
Technical Analysis for Chainlink Price Prediction
Here's what the daily chart behind this chainlink price prediction actually shows.
Price sits inside a symmetrical triangle pattern, supporting rising and resisting flattening out toward a single point. 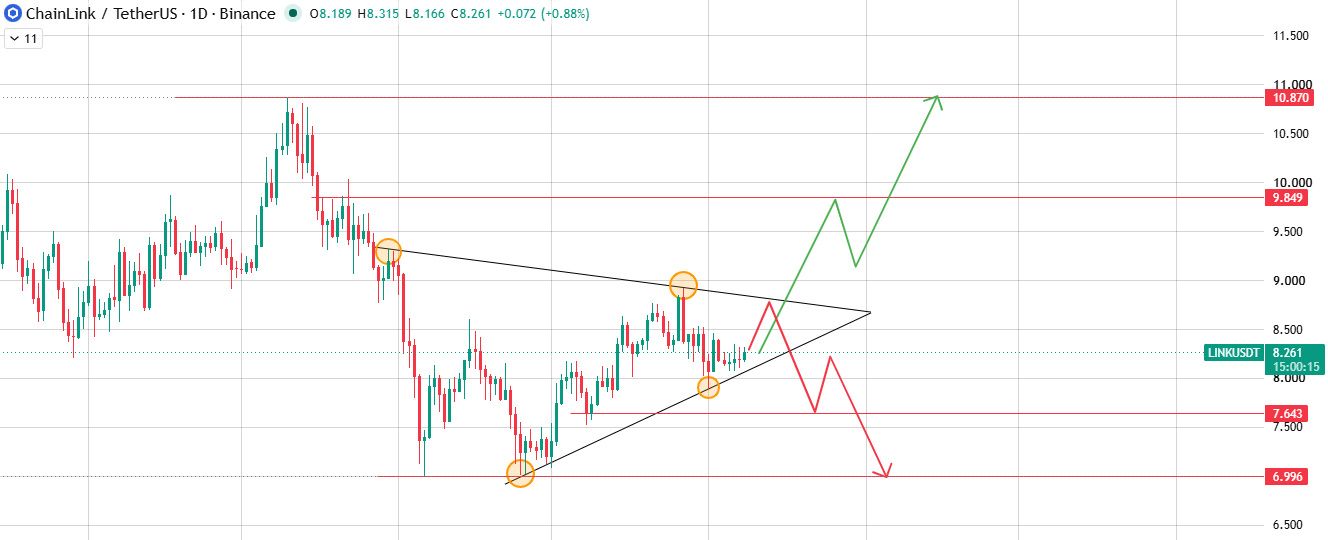
Source: Chart Taken From TradingView.
Break the upper boundary with volume, and it's heading toward the upper levels, $9.849 first, then $10.870.
Break down through the lower boundary instead, and the lower levels take over, $7.643 and then $6.996.
Bull, Base, and Bear Case
Clear the triangle's upper boundary with volume, and this chainlink price prediction leans bullish, $9.849 first, then $10.870.
Break down through the lower boundary instead, and $7.643 comes into view, $6.996 next if that gives way too.
The middle ground? Chop inside the triangle until somebody actually shows up with volume.
Glossary
Two lines closing in from opposite sides until the price has to pick a direction that's a symmetrical triangle pattern.
Ever wonder what resistance means on a chart?
A zone where selling has capped prices before, making the first push through tougher than it looks. Support works the other way.
A level buyers keep defending, right up until the moment they can't.
Methodology:Levels in this chainlink price prediction trace back to daily chart analysis. Liquidation figures come from Coinglass, and exchange volume comes from live futures heatmaps.
Disclaimer: This article is for informational purposes only and does not constitute financial advice. Cryptocurrency markets are highly volatile and speculative. Estimated probabilities reflect technical analysis of chart patterns, not certainty. Always conduct independent research and consult a licensed financial advisor before making investment decisions