DOGE trades near $0.077, below its 50-day and 200-day moving averages, with immediate support between $0.075 and $0.077. Giannis Andreou sees a potential path toward $0.70 if DOGE defends 0.0
- DOGE trades near $0.077, below its 50-day and 200-day moving averages, with immediate support between $0.075 and $0.077.
- Giannis Andreou sees a potential path toward $0.70 if DOGE defends 0.07–0.08 and breaks successive resistance levels.
- Trader Tardigrade compares Dogecoin’s monthly chart with its 2015–2017 structure, suggesting a possible breakout without setting a target date.
Dogecoin trades near $0.077 after October losses erased much of its August and September recovery, while analysts track potential longer-term breakout patterns. Giannis Andreou outlined a possible path toward $0.70 if DOGE clears several resistance levels. Meanwhile, Trader Tardigrade compared Dogecoin’s monthly structure with its 2015–2017 price pattern.
DOGE Chart Shows Pressure Near $0.075 Support
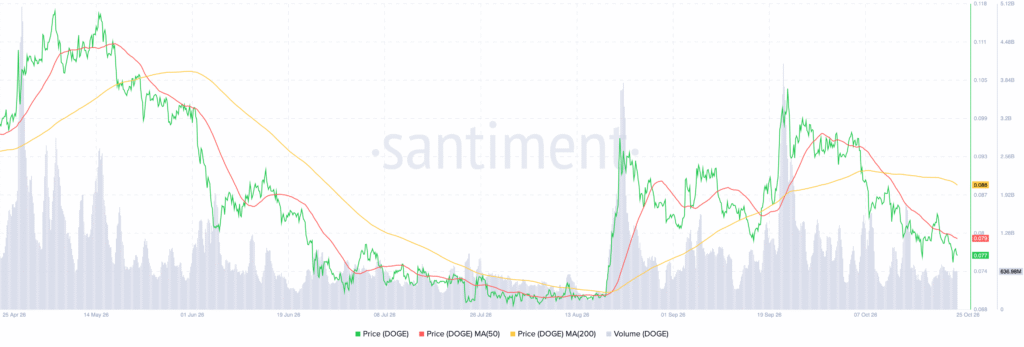
Dogecoin climbed toward $0.117 in late April and May before falling sharply in June. The decline continued through July and early August, bringing DOGE toward 0.070–0.072.
Source: Santiment
A recovery began in mid-August, lifting the price from approximately $0.071 to $0.093. Another rally briefly pushed DOGE above $0.100 in late September. However, selling intensified during October, taking the price below $0.093 and $0.087.
The latest chart places DOGE around $0.077, below its 50-day moving average at $0.079 and 200-day moving average at $0.088. The 50-day average also remains below the 200-day average, reflecting the current bearish structure.
Immediate support lies between $0.075 and $0.077, followed by 0.070–0.072. Resistance is around 0.079–0.080, with another barrier near 0.087–0.088. Trading volume increased during June’s decline and the August–September rallies, although those rallies failed to sustain their gains.
Giannis Andreou Maps a Potential Route Toward $0.70
Andreou said DOGE broke above a steeper descending trendline on the weekly chart, although the broader downtrend remains overhead. He identified 0.07–0.08 as the base DOGE needs to defend for a recovery toward $0.20.
Beyond that level, resistance is at $0.2795. A breakout above the broader trendline, followed by a successful retest, could open a path toward $0.4837. Holding that level as support would place 0.70–0.7372 in focus. However, losing the recent base would weaken this scenario.
https://twitter.com/TATrader_Alan/status/2113940822056149482?s=20
Trader Tardigrade said Dogecoin’s monthly chart resembles its 2015–2017 pattern, featuring a prolonged base followed by a falling wedge. The analyst suggested another breakout could occur, without specifying a date or price target.