What to Know ELON continues trading below the Bollinger Band midpoint amid weakness. RSI remains below 50, signaling bearish momentum still dominates. Long-term projections suggest ELON could
What to Know
- ELON continues trading below the Bollinger Band midpoint amid weakness.
- RSI remains below 50, signaling bearish momentum still dominates.
- Long-term projections suggest ELON could recover if market sentiment improves.
ELON (ELON) remains under pressure as sellers continue to dominate the broader trend. TradingView data shows the token trading near the lower half of its Bollinger Band range following a prolonged decline that began in late April. While several recovery attempts emerged throughout June, buyers have struggled to sustain upward momentum.
Market conditions remain fragile as the token continues trading below its Bollinger Band midpoint, a signal that bears still control the overall structure. However, recent candles show that selling pressure has slowed compared to the sharp decline witnessed earlier this month.
Momentum indicators also suggest that ELON may be attempting to establish a short-term base. Although the Relative Strength Index (RSI) remains below the neutral 50 level, the indicator has recovered from deeply oversold territory, indicating that downside momentum is beginning to ease.
Also Read: DeepNode (DNODE) Price Prediction 2026–2030: Can DNODE Hit $5 Soon?
Downtrend Continues Despite Recent Stabilization
ELON traded within a relatively stable range throughout March and April before sellers gradually gained control of the market. The token repeatedly failed to break above key resistance levels, leading to a steady decline that pushed prices toward new local lows.
Selling accelerated during early June when a series of bearish candles drove the token sharply lower. The move forced ELON beneath both the Bollinger Band midpoint and several short-term support zones.
Recent sessions have shown signs of stabilization. Buyers briefly pushed the token higher during mid-June, but the rally stalled near the middle Bollinger Band, highlighting the strength of overhead resistance. Until price can reclaim that level, recovery attempts may remain limited.
Technical Analysis
The Bollinger Bands show the upper band trending downward, while the middle band continues acting as dynamic resistance. Current price action remains below the midpoint, suggesting sellers still maintain an advantage. Meanwhile, the RSI currently stands near 41.44, while its moving average sits around 44.62. Both readings remain below the neutral 50 level, indicating momentum remains weak despite the recent rebound from oversold conditions.
A successful move above the Bollinger Band midpoint could improve the short-term outlook and encourage a broader recovery attempt. Such a breakout would likely shift attention toward the upper Bollinger Band as the next major resistance target. On the downside, failure to maintain current support levels could expose ELON to another test of its recent lows near the lower Bollinger Band.
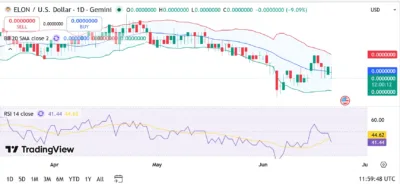
Source: Tradingview
ELON (ELON) Price Predictions (2026–2030)
YearMinimum PriceAverage PriceMaximum Price2026$0.00000008$0.00000015$0.000000252027$0.00000012$0.00000030$0.000000502028$0.00000020$0.00000060$0.000001002029$0.00000035$0.00000120$0.000002002030$0.00000060$0.00000250$0.00000500
Yearly Insights
2026
ELON could spend much of the year consolidating while attempting to build support above current levels.
2027
Improving market sentiment across meme coins may help ELON revisit previous resistance zones.
2028
Broader adoption and stronger speculative interest could support a move toward higher valuations.
2029
If ecosystem activity expands, ELON may enter a stronger growth phase with improved liquidity.
2030
A favorable crypto market cycle could help ELON challenge new multi-year highs.
Conclusion
ELON remains locked in a broader downtrend despite signs that selling pressure is beginning to weaken. The token continues trading below the Bollinger Band midpoint, while RSI readings remain under the neutral threshold, indicating that bulls have not yet regained control.
The most important level to watch is the middle Bollinger Band. A decisive move above that resistance would represent the first meaningful technical improvement in several weeks and could open the door to a stronger recovery.
For now, traders should monitor whether ELON can continue building support near current levels. Sustained stability combined with improving momentum indicators would increase the likelihood of a larger rebound during the coming months.
FAQs
1. Is ELON currently bullish or bearish?
The chart remains bearish as price trades below the Bollinger Band midpoint and RSI stays under 50.
2. What does the RSI indicate?
The RSI reading near 41 suggests momentum remains weak but has improved from oversold conditions.
3. What is the key resistance level?
The Bollinger Band midpoint currently represents the most important resistance zone.
4. What is the biggest downside risk?
A breakdown below recent support could trigger another move toward the lower Bollinger Band.
5. Can ELON recover by 2030?
A broader cryptocurrency bull cycle and stronger market participation could support a long-term recovery trajectory.
Also Read: Chutes (SN64) Price Prediction 2026–2030: Can SN64 Hit $30 Soon?
The post ELON (ELON) Price Prediction 2026–2030: Can ELON Hit $0.00000200 Soon? appeared first on 36Crypto.