Gold is under pressure again. The metal fell on Thursday as Fed officials sounded more hawkish and bond yields jumped. This gold price prediction looks at what is pushing prices down, where t
Gold is under pressure again. The metal fell on Thursday as Fed officials sounded more hawkish and bond yields jumped.
This gold price prediction looks at what is pushing prices down, where the key levels sit, and what could come next for XAU/USD. The latest gold price news is mixed, with strong technical support nearby but heavy macro headwinds.
Gold Price Today: Why Is Gold Falling?
Bullion fell because traders now expect the Fed to keep raising rates. Strong US data this week added fuel.
Several Fed officials backed that view. Governor Michael Barr said it will likely take a series of rate hikes to bring inflation to the 2% target. Susan Collins, Tom Barkin and Albert Musalem made similar comments.
Some agreed the labor market is tight and inflation may be easing. Still, they said it is too early to ease policy.
The metal pays no interest. When yields and the dollar rise, holding it costs more. That is the main reason for the drop in gold price today.
The S&P Global PMI survey came in hot for September. It showed the US economy is doing well, even with higher producer and consumer prices.
Indicator (September)
Reading
Note
Manufacturing PMI
57
Up from 53.9 in August, beat 53.6 forecast
Services PMI
58.7
Strong growth
Composite PMI
58.4
Highest since July 2021
A strong economy gives the Fed room to hold rates high or lift them further. That is bad news for bullion in the short term.
Will the Fed Raise Rates in October 2026?
Markets say yes, for now. The Fed rate decision on October 28 is the next big event.
CME FedWatch shows a 70.9% chance of a 25 basis point hike. Just a month ago, on August 24, that chance was only 11%. On Polymarket and Kalshi, odds of a hike this year are above 80%.
Fed Outcome (Oct 28)
Probability Now
No change (3.75% to 4.00%)
29.1%
25 bps hike (4.00% to 4.25%)
70.9%
Rate cut
0.0%
A hike would move the target range to 4.00% to 4.25%. Bullion usually struggles when the market prices in tighter policy.
Why Is the US 10-Year Treasury Yield Hurting Gold?
The 10-year yield spiked to 5.13%, a two-decade high. Investors can earn a solid return from bonds, so some money leaves the metal.
Short-term government bonds also look more attractive. It tends to lag whenever yields climb this fast.
Oil Prices and Inflation: A Second Pressure on Bullion
Energy markets add to inflation worries. Brent rose to $102.5, and WTI moved to $92 overnight.
Fuel costs are following. AAA data shows US gasoline at $4.47 a gallon. Diesel hit a record $6.52.
President Trump is weighing a US diesel export ban to bring prices down. Energy prices are set by global markets, so the effect of such a ban is unclear.
There is a small positive here. Oil has eased on better talks with Iran and improved Gulf supply. If oil keeps falling, inflation pressure could fade and cap how high the Fed goes.
Is There Any Support for Demand?
Yes. Investment demand is still growing, even as the price dips.
This kind of buying can slow big drops. It does not stop them, but it shows buyers are active near these levels.
Gold Price Forecast: Elliott Wave and Key Levels
The daily chart shows a bigger bullish structure with a pullback inside it. Price climbed from $3,946 to $4,701, which looks like the first impulsive leg (Wave 1).
The drop toward $4,200 to $4,235 may be a Wave 2 correction. The 38.2% Fibonacci retracement at $4,234.61 is the level to watch.
If price holds this zone, the bullish count stays intact. A new upward leg could then build.
XAU/USD Support and Resistance Levels
Type
Level
Meaning
Resistance
$4,323.75
First Fibonacci hurdle
Resistance
$4,412.90
Second Fibonacci hurdle
Resistance
$4,539.81
Third Fibonacci hurdle
Resistance
$4,701
Wave 1 high, key breakout level
Support
$4,234.61
38.2% retracement, main pivot
Support
$4,124
23.6% retracement
Support
$3,946
Swing low, wave count fails below it
Gold Price Prediction 2026: Bullish and Bearish Scenarios
The gold price prediction for 2026 depends on how the market reacts around $4,235 and $4,701.
Bullish case: Price holds the $4,200 to $4,235 band. A move above $4,701 would support a Wave 3 advance. The first target is $4,900 to $5,000. Higher extension levels sit near $5,183, $5,457, and $5,602.
Bearish case: A clear break below $4,124 would show more correction pressure. A drop under $3,946 would cancel the current wave structure.
Nobody knows which path comes next. The Fed meeting, yields, and oil could all change the picture fast.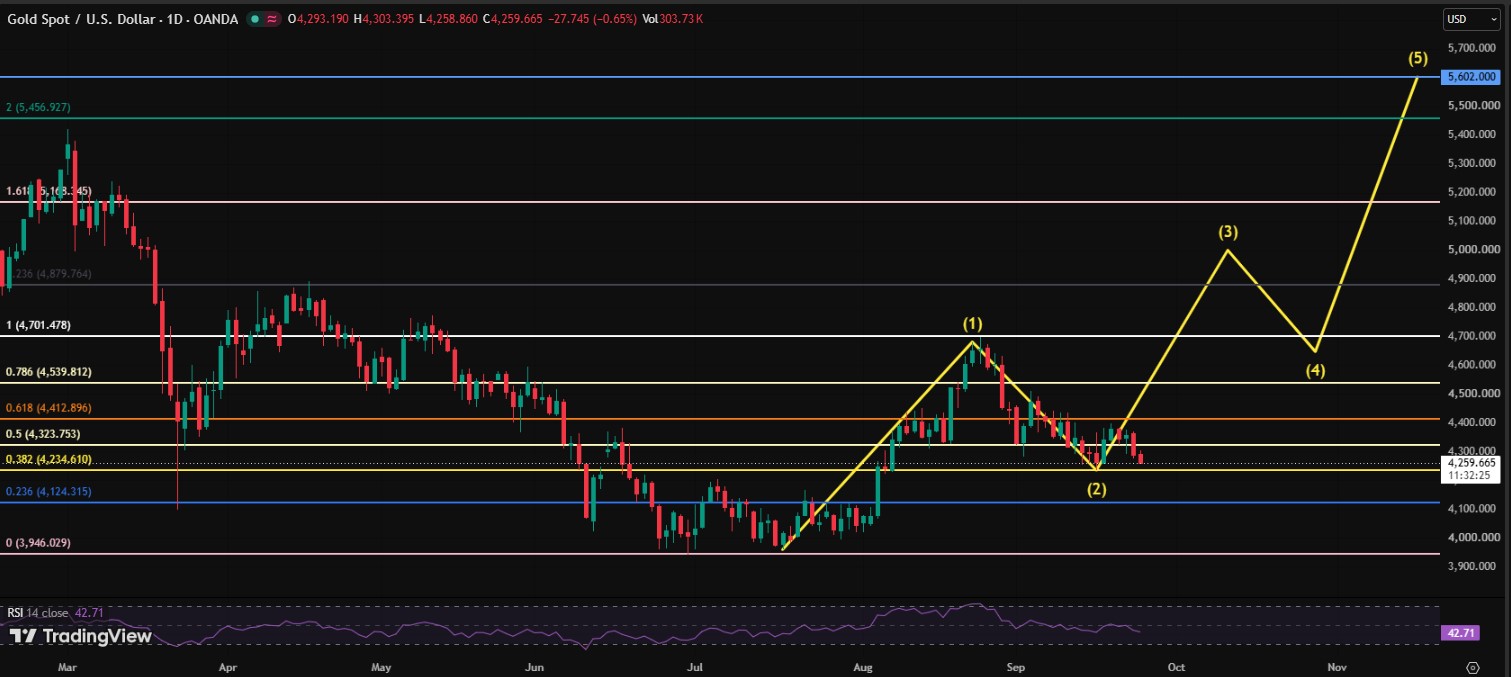
Gold Price Prediction Today: What to Watch Next
A few things will shape the next moves:
The October 28 Fed rate decision
The US 10-year yield near 5.1%
Brent and WTI oil prices
New Fed speeches and US inflation data
ETF flows and central bank buying
This precious metals forecast stays cautious in the short term, and any gold prediction should stay flexible. The bigger trend has not broken yet.
Final Take on Gold Price Prediction
The metal faces strong headwinds from Fed hike bets, a high dollar and rising yields. Still, the $4,200 to $4,235 support zone keeps the bullish view alive.
A hold there and a break above $4,701 would change the mood. A drop under $4,124 would do the opposite. Traders should watch these levels closely.
Disclaimer
This article is for information only and is not financial advice. Gold and other assets carry high risk, and prices can move fast. Past performance does not guarantee future results. Do your own research and speak with a licensed financial advisor before you invest.