HBAR remains below its descending trendline, with the current Elliott Wave structure pointing toward another possible downward move. A corrective wave four rebound could encounter resistance
- HBAR remains below its descending trendline, with the current Elliott Wave structure pointing toward another possible downward move.
- A corrective wave four rebound could encounter resistance between $0.064 and $0.076 if buyers reclaim the descending trendline.
- Hedera recorded 17,097 monthly commits, while its price weakness leaves $0.046 as the next major support reference.
HBAR price outlook remains under pressure as the weekly chart points toward further downside, despite record developer activity and recent attempts at recovery.
HBAR Maintains Its Downward Technical Structure
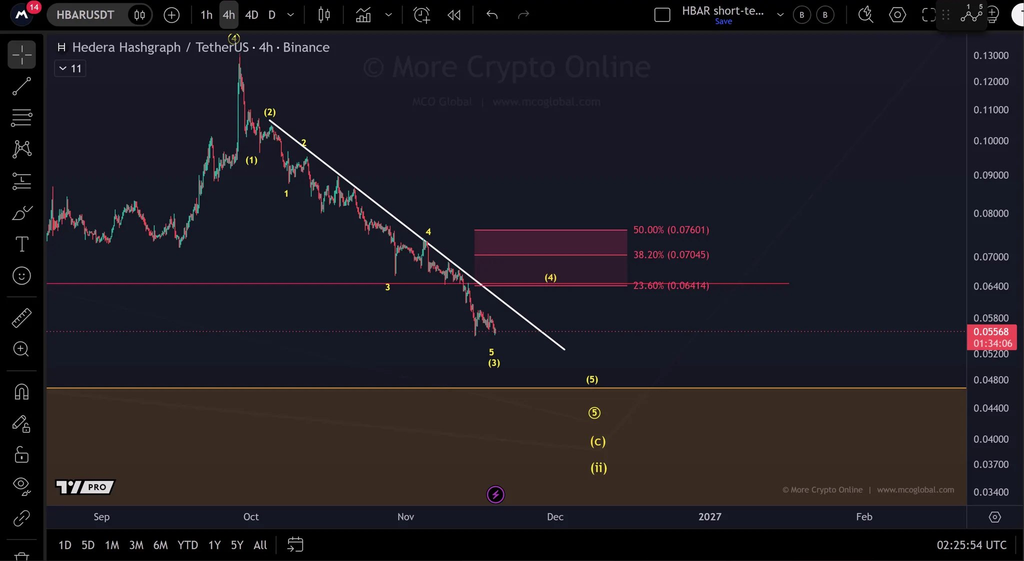
The More Crypto Online maintains a bearish reading of HBAR's current structure. The analyst identifies the white descending trendline as the main barrier to recovery. Price has continued trading beneath this boundary, keeping downward pressure firmly in place.
Source:
X
The Elliott Wave count suggests HBAR could be completing another downward sequence. The chart identifies earlier movements as waves one through four. The projected fifth wave remains the next stage of this declining structure.
However, a temporary recovery could develop through the proposed yellow wave four. Such a move would represent a corrective rebound within the broader decline. It would not necessarily establish a lasting change in direction.
The white trendline remains the earliest technical level to watch. A break above it would provide the first indication of easing selling pressure. Until then, the existing downward structure remains the dominant chart signal.
Fibonacci Levels Define the Next Price Targets
The potential wave four recovery has a resistance range between $0.064 and $0.076. The chart identifies several Fibonacci retracement levels within this region. These include the 38.2% and 50% retracement levels, alongside the upper boundary.
The lower part of this resistance band provides the first recovery reference. HBAR would need to reclaim approximately $0.064 before approaching higher retracement levels. Reaching this area would still leave the broader bearish structure unresolved.
On the downside, the next larger-degree Fibonacci support sits near $0.046. This level represents an important reference if the current decline continues. The highlighted region surrounding it also provides a wider potential stabilization area.
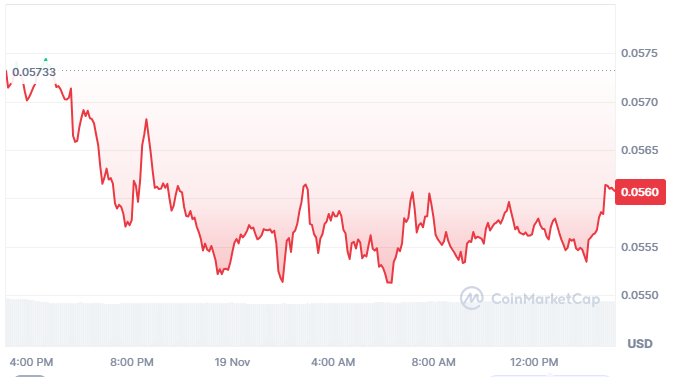
The recent price chart shows HBAR trading around $0.05578. Its 24-hour performance registered a 2.77% decline during the displayed session. Price moved from approximately $0.0573 toward $0.0550 before recovering slightly.

Developer Activity Contrasts With Market Weakness
The intraday chart shows repeated attempts to recover throughout the trading session. However, sellers repeatedly returned whenever price approached higher levels. The late recovery toward $0.0560 has not yet changed that pattern.
Source:
Coinmarketcap
Market capitalization stood around $2.77 billion in the supplied snapshot. Meanwhile, 24-hour trading volume reached approximately $43.8 million, down 3.64%. These figures accompany a price structure that continues showing short-term weakness.
Hedera's development activity presents a different picture from its market performance. Chainpect data recorded 17,097 monthly commits as of November 17. This represents the highest monthly figure shown in the supplied development statistics.
The same data places average daily contributions at approximately 570 commits. Such activity reflects continued work across Hedera's development repositories. However, commit totals alone cannot establish software quality or actual network adoption.
The contrast between technical weakness and developer activity remains important. HBAR's market structure still points toward possible further losses. Meanwhile, the development record provides evidence of continued work across the ecosystem.
For the technical outlook, the descending trendline remains the immediate test. A confirmed break could open the way toward the 0.064–0.076 resistance region. Failure to reclaim it would leave the $0.046 Fibonacci support in focus.
The proposed wave four rebound remains conditional on a change in price structure. More Crypto Online has not identified a confirmed bullish signal yet. Consequently, the current Elliott Wave interpretation continues to favor caution.
HBAR therefore faces two different measures of progress across its ecosystem. Developer contributions have reached a record, but market momentum remains weak. Price behavior around the trendline and Fibonacci levels will determine the next technical development.