Silver opened the week around $66.21, down about 1.15% on the day. Sounds bearish at first, but the daily candle tells a different story. The silver price actually dropped as low as $64.74 be
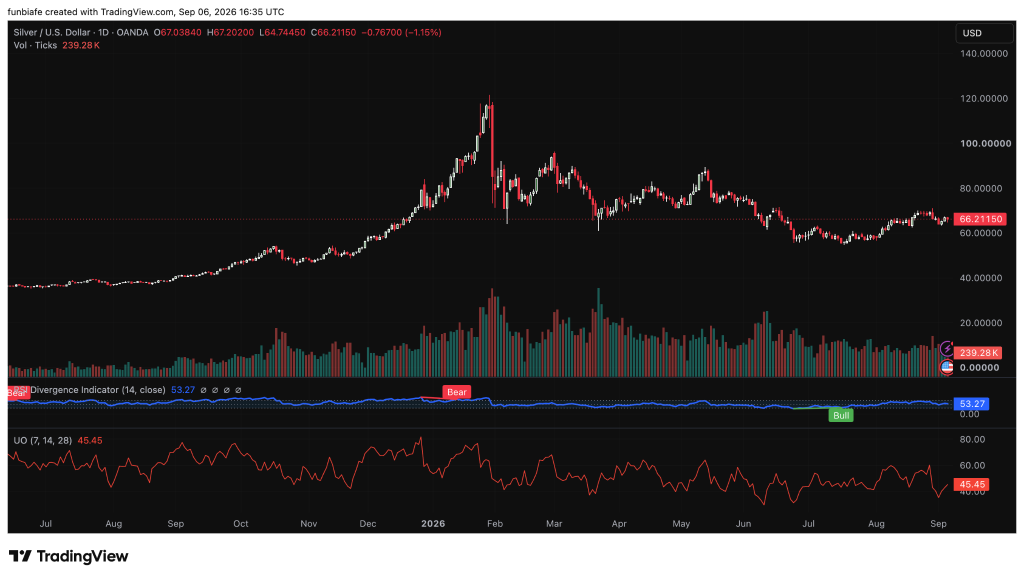
Silver opened the week around $66.21, down about 1.15% on the day. Sounds bearish at first, but the daily candle tells a different story. The silver price actually dropped as low as $64.74 before buyers stepped in and pushed it back toward the middle of the range.
The high of the day hit $67.20, so there was a wide swing. Volume was solid too, 239,280 ticks backing that action. So it wasn’t a simple down day. There’s more going on underneath.
We had a look at the Silver chart, and one thing stands out: the market is still trapped inside a broad consolidation zone. Sellers have not been able to force a break below $60, and buyers have not been able to push the Silver price above $80.
 Source: TradingView
Catalysts That Could Affect the Silver Price
A big catalyst came from Fed Chair Kevin Warsh, who struck a hawkish tone at the Jackson Hole symposium. He made it clear that policymakers still need more proof that inflation is actually heading back to target.
That shifted expectations for the Fed’s next meeting on September 15-16. The CME FedWatch Tool showed the odds of at least a 25-basis-point rate move jumping to 57.5%, up from 35% before Warsh spoke. So the market started pricing in tighter policy pretty quickly.
That matters because higher interest rates tend to reduce the appeal of non-yielding assets such as Silver. Silver also had to contend with rising oil prices after tensions flared up in the Middle East. With military activity near the Strait of Hormuz sparking concerns, energy markets moved higher, adding another layer of pressure on precious metals.
Read Also: Gold and Silver Could Be Entering Their Biggest Change in 50 Years, and Ripple Is Suddenly in the Picture
The Technical Picture Remains Mixed
The indicators aren’t giving a clear signal yet. RSI is at 53.27, leaning just slightly bullish but basically neutral. And there are both bullish and bearish divergences on the chart, so momentum is still split.
The Ultimate Oscillator is at 45.45, below the 50 level, so that’s a mild bearish tilt. But it’s also starting to turn higher, which shows buyers haven’t completely stepped away. So it’s a mixed read.
Taken together, the indicators point to one conclusion: Silver is at a decision point, and the next major move will likely come after a breakout from the current range.
How High Can the Silver Price Go This Week?
The first target traders are watching is $80. From the current silver price of $66.21, a move to $80 would be about 20.8% upside. That’s probably the most realistic bullish target if buyers take control this week.
Above $80, the next major resistance levels are $100, $120, and eventually $140, which lines up with the previous peak on the chart. So the path is there for the bulls if they can build some momentum.
Analysts at TD Securities noted that investors continue to show interest in precious metals as concerns about currency debasement remain part of the macro discussion. The firm also pointed to growing investor interest in the sector despite the recent pressure from higher rate expectations.
FAQs
Is now a good time to buy Silver
The chart shows the Silver price trading between major support at $60 and resistance at $80. Many traders prefer to wait for a confirmed breakout above resistance or a breakdown below support before making a directional trade.
How does geopolitical tension affect the Silver priceGeopolitical events can increase volatility across commodity markets. Rising tensions in the Middle East have boosted oil prices and influenced investor positioning in precious metals, including Silver.
Subscribe to our YouTube channel for daily crypto updates, market insights, and expert analysis.
The post Here’s How High the Silver Price Might Go This Week appeared first on CaptainAltcoin.