XRP rallied from $0.9852 to $1.6992, a gain of roughly 72%. For a time, that looked like the recovery Dark Defender had been waiting for. He had one condition for calling it the start of a ne
XRP rallied from $0.9852 to $1.6992, a gain of roughly 72%. For a time, that looked like the recovery Dark Defender had been waiting for. He had one condition for calling it the start of a new advance. When sellers returned, buyers had to defend $1. They couldn’t.
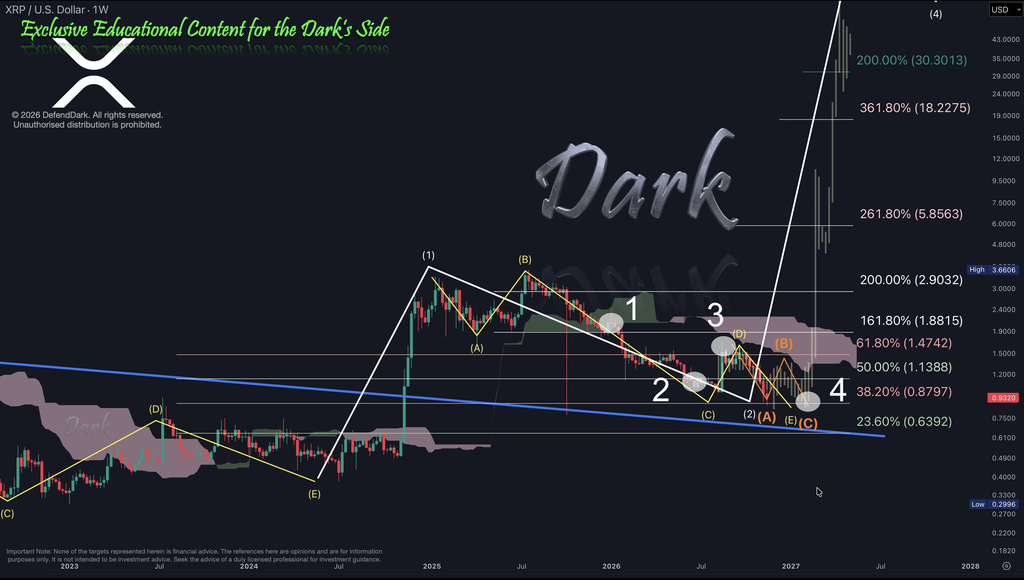
With XRP at $0.9320 on his weekly chart, Dark Defender has revised his reading of the rally. He now counts the move to $1.6992 as another swing inside the correction. Yet he still expects what he calls “one of the biggest XRP reversals ever.” To understand why he can change his mind about a 72% rally and keep that forecast, it helps to follow the two sets of lines on his chart.
Why Dark Defender Changed His XRP Wave Count
Start with the yellow line. It traces the swings after the peak marked with a white (1). XRP fell into A, recovered into B, then sold off again into C. Dark Defender initially read those three moves as a completed correction. When the last decline stretched to $0.9852, he revised the pattern to an expanded flat. Even with that deeper low, he still had a case for calling C the end of the selloff.
The bounce to $1.6992 gave him a chance to test that idea. If a new upward wave had begun near $0.9852, the next pullback ought to leave that low intact. Instead, XRP gave back the entire rally and traded below its starting point. That tells us more about the strength of the recovery than the 72% figure alone.
 Source: X/@DefendDark
On the revised chart, the $1.6992 high becomes D. The decline that followed becomes E, the fifth swing in the yellow pattern. The larger white line tells a different part of the story. Dark Defender still places the whole sequence inside Wave 2, a correction of the earlier advance marked as Wave 1. His forecast depends on that interpretation. He allows for another low before a sustained recovery begins.
What the XRP Weekly Chart Shows Below $1
The nearest marked level below the chart price is $0.8797, the 38.2% Fibonacci line. That’s about 5.6% below $0.9320. The projected yellow E leg ends close to that area. The orange path takes a longer route, with room for another bounce before XRP comes down again. That second path is worth a look after what happened at $1.6992. Even a sizable rally can fit inside his bearish near-term count.
If selling continues through $0.8797, the next horizontal level drawn below it is $0.6392. Dark Defender doesn’t identify that as his bottom call or give the price that would invalidate his larger Wave 2 count in the public post. Those are separate questions, and the chart only gives readers a firm answer on the earlier $1 test.
What Would Make the XRP Reversal More Convincing?
For us, the most revealing number on this chart is still $1.6992. Getting back above $1 would be a start. XRP would then face marked levels at $1.1388 and $1.4742. But buyers have already taken the price through both on the way to $1.6992 and surrendered every cent of that move. A recovery through the old rally high, followed by a pullback that holds above the previous low, would give this rebound something the last one lacked.
Dark Defender’s longer-range projections reach $5.8563, $18.2275 and $30.3013. The nearer hurdle puts those numbers in perspective. From $0.9320, XRP would need to gain about 82% just to revisit $1.6992. The next time buyers put together a rally of that size, the best clue on this chart may come a few weeks later, when sellers get their turn again.
For more crypto news and price predictions, click here.
Subscribe to our YouTube channel for daily crypto updates, market insights, and expert analysis.
The post Here’s Where XRP Price Could Bottom After Losing $1 appeared first on CaptainAltcoin.