Gold price has suffered a painful reversal over the past month. After climbing to almost $4,700 in late August, the precious metal has fallen roughly 8%, with prices now hovering around $4,25
Gold price has suffered a painful reversal over the past month. After climbing to almost $4,700 in late August, the precious metal has fallen roughly 8%, with prices now hovering around $4,250–$4,300.
The latest leg lower has been particularly notable. Gold dropped around 1.5% on Wednesday, and the pressure has carried into September 24. Spot gold was quoted around $4,290 today, leaving the metal near a one-week low.
There does not appear to be one dramatic gold-specific catalyst behind the decline. Instead, the biggest problem is coming from the U.S. bond market.
Treasury Yields Are Hammering Gold
The U.S. 10-year Treasury yield exploded to approximately 5.12% on September 23, its highest level since July 2007. The move followed stronger-than-expected U.S. business activity data, while renewed inflation concerns increased expectations that the Federal Reserve may need to tighten monetary policy further.
That is a difficult combination for gold.
Gold produces no interest income. As Treasury yields climb above 5%, investors can earn increasingly attractive returns from government bonds, raising the opportunity cost of holding bullion.
The same rate story has also supported the U.S. dollar, creating another obstacle for gold. A stronger dollar generally makes dollar-denominated gold more expensive for international buyers. Recent reporting points to the combination of higher yields, a stronger dollar and expectations for additional Fed tightening as the main forces weighing on bullion.
Importantly, there isn’t an obvious second catalyst that explains the entire decline. Gold appears to be dealing primarily with a macro environment that has become substantially less favorable after its enormous earlier run.
Gold Chart Shows Sellers Still in Control
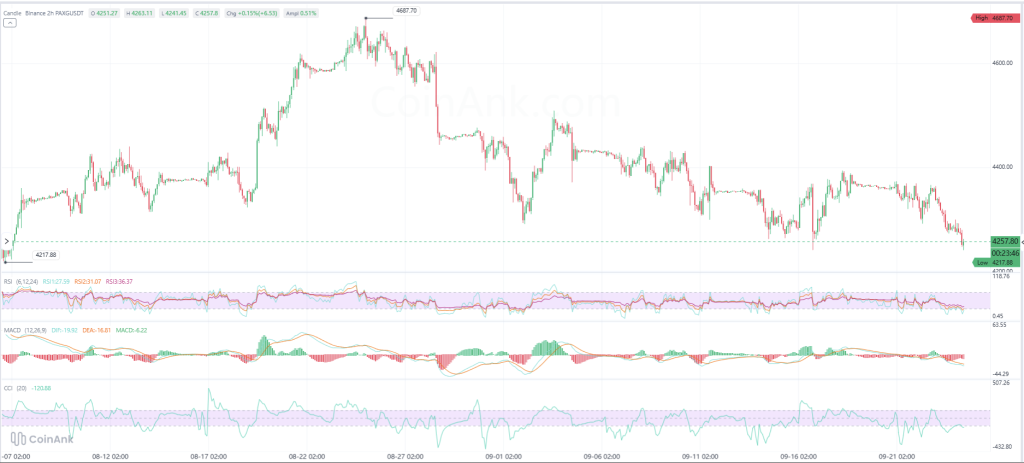
The PAXG/USDT two-hour chart provides a useful proxy for the recent gold move.
PAXG peaked around $4,687.70 in late August before beginning a sequence of lower highs and lower lows. Several recovery attempts followed, but each failed beneath the previous major peak.
The latest decline has taken PAXG to approximately $4,258, very close to the chart’s recent low around $4,217.88. That makes the $4,200–$4,220 region particularly important.
 Source: CoinAnk
Momentum indicators remain weak.
The shortest RSI reading on the chart is approximately 27.6, while the other displayed RSI readings sit around 31 and 36. That puts short-term momentum near or inside oversold territory.
Oversold does not automatically mean gold is ready to rebound. During a strong decline, RSI can remain depressed for an extended period. But it does indicate that selling has become stretched enough for a relief rally to become increasingly possible.
MACD is similarly bearish. The chart shows the DIF around -19.92, DEA around -16.81 and the histogram near -6.22. Both lines are below zero and the histogram remains negative, indicating that downside momentum remains dominant.
CCI provides another indication of stretched selling conditions. It sits around -120.9, below the commonly watched -100 level. Again, that can precede a rebound, but it is not confirmation that a bottom has formed.
What Comes Next for Gold?
The immediate battle appears to be around $4,200–$4,250.
Other current technical analysis places an important support cluster around $4,230–$4,235, broadly matching what can be seen on the PAXG chart. A decisive loss of this region would leave gold vulnerable to a deeper correction.
On the other hand, gold is becoming increasingly oversold on the shorter timeframe. If Treasury yields cool and the dollar loses some strength, the combination of depressed RSI and CCI readings could provide conditions for a relief rally.
The first meaningful recovery area would be around $4,350–$4,400. Gold repeatedly traded around this region during September, making it an obvious area where sellers could return. Current external technical analysis similarly identifies roughly $4,385–$4,405 as an important resistance region.
For the coming weeks, the bond market may matter more than almost anything happening within the gold market itself.
If the 10-year Treasury yield remains above 5% or pushes further upward, gold could continue testing lower support despite its oversold indicators. If yields retreat and expectations for additional Fed tightening cool, the current oversold readings could finally give buyers an opening.
For more financial news and price predictions, click here.
Subscribe to our YouTube channel for daily crypto updates, market insights, and expert analysis.
The post Here’s Why Gold Price Is Getting Wrecked Right Now appeared first on CaptainAltcoin.