Silver has spent the past several months frustrating both bulls and bears. After an explosive rally that pushed prices above $115 earlier in 2026, the metal has retraced and is now trading ne
Silver has spent the past several months frustrating both bulls and bears. After an explosive rally that pushed prices above $115 earlier in 2026, the metal has retraced and is now trading near $59.60.
While many investors view this as a loss of momentum, the larger technical outlook suggests something very different. Let us look at why silver price is about to reset before its most explosive move yet and why the current consolidation phase may be the foundation for what comes next.
Silver Price Today: Why the Recent Pullback Is Bigger Than It Looks
Silver is currently trading around $59.60 and has dropped from its 2026 peak near $118-120. Even though that appears severe in percentage terms, the overall trend tells a more balanced story.
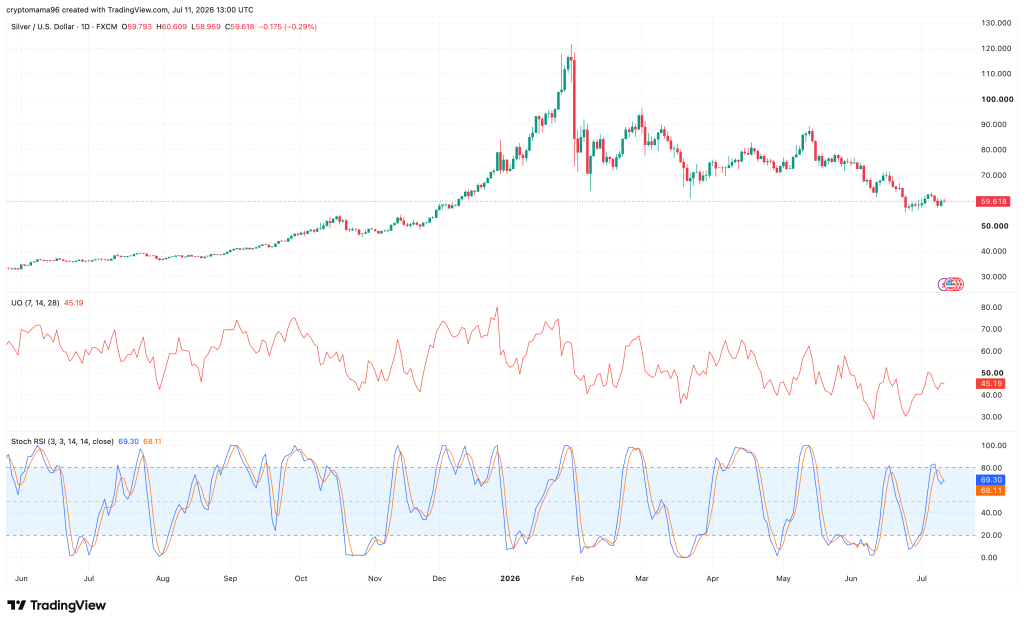
The daily chart shows that the vertical rally into late January created an unsustainable extension above long-term trend. The collapse wasn’t simply profit-taking, it was the market correcting an overextended advance. Since that sharp drop, silver has spent nearly five months moving sideways-to-lower between approximately $56 and $90.
More importantly, price has repeatedly found buyers near the $56-58 support zone. This area has now been defended several times during June and July.
Source: TradingView
The recent slump also differs from the January crash in one important way: selling pressure has become progressively weaker. Instead of aggressive impulsive declines, recent silver price action consists of smaller pullbacks followed by stabilization.
The Ultimate Oscillator validates this transition. On both the daily and 4-hour charts, readings have cooled into the mid-40s after reaching much higher levels during previous rallies.
This neutral positioning shows neither buyers nor sellers currently possess decisive control, which is a typical characteristic of consolidation phases.
Silver Chart Analysis: The Pattern That’s Flashing a Major Reset Signal
The dominant pattern across both timeframes is a large corrective base developing after a major advance.
This structure provides context for understanding why silver price is about to reset and what that reset means for future direction.
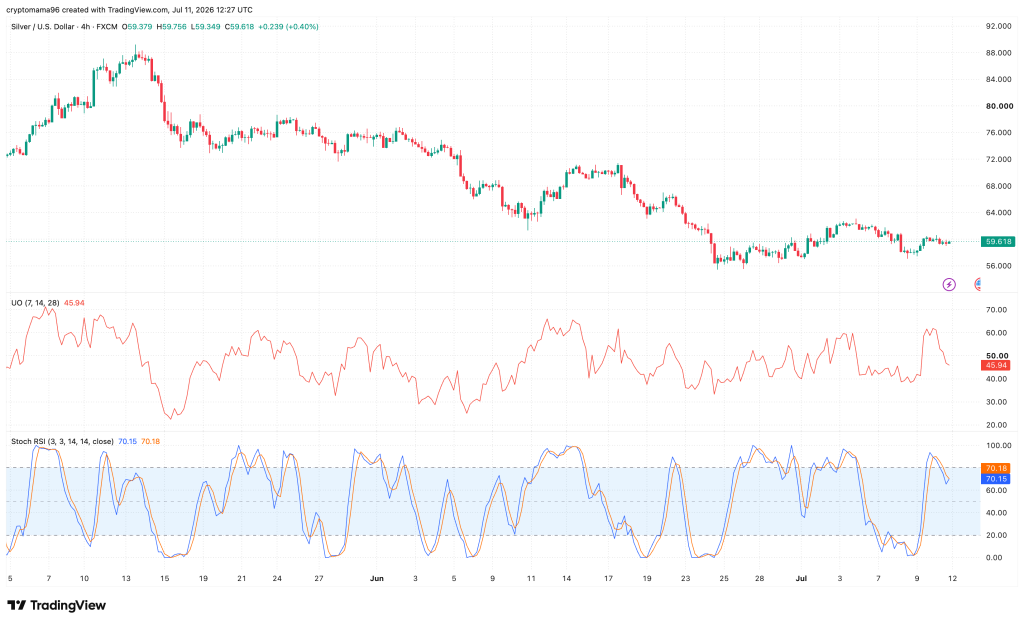
Following the January peak, silver established a sequence of lower highs around $92, $86, $82, and finally the recent July highs near $63.
Equally important is what has happened on the downside. Instead of continuing toward the pre-breakout region near $45-50, silver has consistently stabilized around $56-58.
This repeated defense is creating a horizontal support floor while resistance gradually compresses lower.
Source: TradingView
On the 4-hour chart, price has moved from directional selling into a relatively tight trading range between approximately $56 and $62. Volatility has contracted compared with the violent swings seen earlier in the year.
The Stochastic RSI on both timeframes has repeatedly cycled between overbought and oversold without creating directional movement.
Rather than confirming trend continuation, these oscillations mean that energy is being worked off inside consolidation.
Meanwhile, the Ultimate Oscillator remains near neutral. This shows a balanced buying and selling pressure. This combination usually appears during accumulation or base-building phases rather than during major bear markets.
Read also: Gold and Silver Price Forecast: Popular Analyst Says Buy the Panic at $3,600 and $50
Silver Price Prediction: What Happens After the Reset Completes
Understanding silver price prediction needs examining the key levels that will decide the next major move. The next directional trend will likely depend on whether silver can reclaim nearby resistance levels.
The first obstacle sits around $62-64, where recent rallies have repeatedly stalled on the 4-hour chart. Above that, the market would face stronger resistance near $68-70, which will be followed by the broader supply zone around $78-82 that capped several rebounds throughout the spring.
A decisive breakout above those levels would complete the current base and change market structure back toward higher highs.
Conversely, the most important support remains $56-58. As long as this floor continues to hold, the correction remains technically healthy. Only a sustained breakdown below this region would open the door toward retracements into the low-$50s or upper-$40s.
Silver Price Forecast 2026: Why the Most Explosive Move Is Still Ahead
The long-term daily structure remains constructive despite the pullback. The silver price forecast 2026 picture suggests the current reset is setting up conditions for a powerful advance once the consolidation completes.
Before reaching January’s peak, silver spent months building higher highs and higher lows before eventually moving into a breakout. Markets that experience such quick pumps rarely resume trending immediately after the first correction.
If buyers eventually reclaim $70, the probability increases that silver could challenge the $80-90 resistance region later in 2026. A successful break above that zone would bring the January highs back into focus over the longer term.
For now, the key level remains $56-58. As long as silver continues defending that area while gradually compressing beneath resistance, the larger bullish structure remains intact.
Frequently Asked Questions
What is XAG Silver

XAG is the international ticker symbol for silver in the global financial markets. It represents one troy ounce of silver and is commonly paired against the U.S. dollar as XAG/USD.
How much is 1 XAG
The price of 1 XAG changes throughout the trading day. One XAG equals one troy ounce of silver, so its value matches the current spot price of silver.
Is XAG real silver
Yes. XAG is the market symbol for physical silver. While traders often buy and sell XAG through financial products like ETFs, futures, or CFDs, the symbol itself refers to one troy ounce of real silver.
Subscribe to our YouTube channel for daily crypto updates, market insights, and expert analysis.
The post Here’s Why Silver Price Is About to Reset Before Its Most Explosive Move Yet appeared first on CaptainAltcoin.