What to Know: HIVE trades at $4.20, holding above the $4.06 Bollinger midpoint while buyers target resistance around the $4.49 upper boundary. RSI stands at 51.85, reflecting balanced momentu
What to Know:
- HIVE trades at $4.20, holding above the $4.06 Bollinger midpoint while buyers target resistance around the $4.49 upper boundary.
- RSI stands at 51.85, reflecting balanced momentum with a slight bullish advantage as the indicator remains above its 49.63 average.
- Defending $4.06 could preserve HIVE’s recovery, whereas losing that level may expose support around $3.80 and the $3.63 lower band.
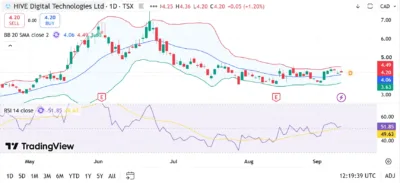
HIVE Digital Technologies (HIVE) shares are trading near $4.20, recording a 1.20% daily increase while maintaining their position above the middle Bollinger Band. The stock opened at $4.25, reached $4.36 and recorded an intraday low of $4.20.
Buying pressure has gradually strengthened since HIVE recovered from its August lows, although the stock remains below the upper Bollinger Band at $4.49. Meanwhile, the 14-day Relative Strength Index (RSI) stands at 51.85, placing momentum inside neutral territory with a modest bullish inclination.
Also Read: Firo (FIRO) Price Prediction 2026–2030: Can FIRO Hit $5 Soon?
HIVE Builds Support Above C$4
HIVE experienced considerable volatility between May and July, climbing from approximately $3.00 to above $7.00 before sellers regained control. The subsequent correction erased much of that advance and pushed the stock toward the $3.40 region during August.
Price has since established a more stable structure, with buyers defending lower levels and restoring HIVE above the $4.06 middle Bollinger Band. Recent candles also show repeated attempts to strengthen support around $4.00.
A decisive daily close above $4.36 could allow HIVE to test the upper Bollinger Band at $4.49. Clearing that resistance may expose $4.60, followed by the psychological C$5.00 level.
Conversely, rejection around $4.36–$4.49 could return the stock toward $4.06. Losing the central band would weaken the recovery and potentially expose $3.80 before the lower Bollinger Band at $3.63 becomes relevant.
Bollinger Bands Reflect Lower Volatility
HIVE’s Bollinger Bands have narrowed considerably compared with their expansion during the May and June rally. The upper band stands at $4.49, while the middle and lower bands are positioned at $4.06 and $3.63, respectively.
The tighter formation reflects reduced volatility and suggests that HIVE is consolidating within a more defined range. Trading above the middle band gives buyers a technical advantage, but the stock must overcome $4.49 to confirm stronger upside momentum.
A breakout above the upper boundary could produce an expansion toward $4.80 and $5.00. However, movement beneath $4.06 may shift control toward sellers and increase pressure on the $3.63 support area.
RSI Shows Balanced Momentum
HIVE’s RSI reading of 51.85 remains slightly above the neutral level of 50 and its moving average at 49.63. This positioning indicates that buying momentum has improved without placing the stock near overbought territory.
An RSI advance above 60 could accompany a successful breakout through $4.49, strengthening the probability of an extension toward $5.00. Rising momentum would also support the formation of higher lows across the daily chart.
Nevertheless, a decline below the 49.63 average would indicate weakening demand. Such movement could place additional pressure on $4.06 and potentially send the RSI toward 40 if sellers regain control.
Source: TradingView
HIVE Digital Technologies (HIVE) Stock Price Prediction 2026–2030
YearMinimumAverageMaximum2026$3.20$4.80$6.502027$3.80$6.20$8.502028$4.50$7.80$10.502029$5.50$9.50$12.502030$6.50$11.00$15.00
Price Forecast by Year
2026
Holding above $4.06 could enable HIVE to preserve its developing recovery and challenge $4.49 again. Stronger demand may carry the stock toward $5.00 and a projected maximum of $6.50. However, losing the lower Bollinger Band at $3.63 could deepen selling pressure. Under bearish conditions, HIVE may approach the projected minimum of $3.20.
2027
Improving demand for high-performance computing and digital-asset infrastructure could support a broader HIVE recovery. Under favorable conditions, the stock may average $6.20 and reach approximately $8.50. Reaching that range would require sustained revenue growth, disciplined expansion and supportive market conditions. Weaker performance could instead keep HIVE near its projected $3.80 minimum.
2028
HIVE could approach $10 if buyers establish a longer-term pattern of higher highs and higher lows. The projected average stands at $7.80, while $4.50 represents the bearish estimate. A decisive break above $8.50 would strengthen the outlook and potentially open a move toward the C$10.50 maximum. Broader technology-sector sentiment would remain an important valuation driver.
2029
Greater adoption of artificial intelligence infrastructure and stronger digital-asset markets could help HIVE reach a maximum price of $12.50. Under balanced conditions, the stock may trade near an average of $9.50. Nevertheless, operational challenges or weaker market demand could restrict growth. Those conditions may return HIVE toward its projected minimum of $5.50.
2030
HIVE could reach $15 under an optimistic long-term scenario. Moving from the chart price of $4.20 to $15 would require an increase of approximately 257%. Such an advance would depend on successful infrastructure expansion, stronger earnings, favorable cryptocurrency markets and sustained investor demand. Without those catalysts, HIVE may remain closer to the projected $11 average or $6.50 minimum.
Conclusion
HIVE Digital Technologies has developed a cautiously bullish structure, with shares trading near $4.20 following a 1.20% daily gain. Buyers have maintained price above the $4.06 Bollinger midpoint while targeting the $4.49 upper boundary.
Moreover, the RSI reading of 51.85 reflects balanced momentum rather than overbought conditions. Holding $4.06 would preserve the immediate recovery, while losing that level could expose $3.80 and $3.63. Reaching $15 by 2030 remains possible under an optimistic scenario, although the target requires sustained growth and several successful resistance breakouts.
FAQs
1. Is HIVE currently bullish?
HIVE maintains a cautiously bullish structure above the middle Bollinger Band, while its RSI slightly favors buyers without showing overbought conditions.
2. What is the main resistance level for HIVE?
The upper Bollinger Band at $4.49 represents immediate resistance, followed by potential barriers around $4.60 and $5.00.
3. What are the important HIVE support levels?
Immediate support stands at $4.06, while deeper support appears around $3.80 and the lower Bollinger Band at $3.63.
4. Can HIVE reach C$15 by 2030?
HIVE could reach $15 under an optimistic growth scenario, requiring an increase of approximately 257% from the chart price of $4.20.
5. What could weaken the HIVE stock price prediction?
Weak earnings, reduced computing demand, cryptocurrency market losses, rejection at $4.49 and a breakdown below $3.63 could weaken the outlook.
Also Read: ANyONe Protocol (ANYONE) Price Prediction 2026–2030: Can ANYONE Hit $2 Soon?
The post HIVE Digital Technologies (HIVE) Stock Price Prediction 2026–2030: Can HIVE Hit $15 Soon? appeared first on 36Crypto.