What to Know Humanity remains above key Fibonacci support levels despite recent volatility. Price trades above all major moving averages, confirming bullish momentum. Technical indicators sug
What to Know
- Humanity remains above key Fibonacci support levels despite recent volatility.
- Price trades above all major moving averages, confirming bullish momentum.
- Technical indicators suggest buyers are regaining control after consolidation.
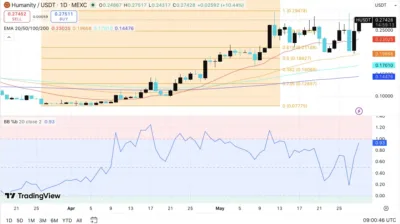
Humanity (HUSDT) continues to display strong bullish momentum as the token trades near the upper end of its recent trading range. The latest daily chart from MEXC shows HUSDT changing hands around $0.274, following a strong rebound from recent lows and maintaining its position above all major exponential moving averages.
The broader trend remains constructive, supported by rising moving averages and a series of higher highs and higher lows. Recent price action shows HUSDT holding above the 0.618 Fibonacci retracement level, indicating that buyers continue defending key support zones. While short-term volatility remains present, the technical structure suggests the market is preparing for another attempt toward higher resistance levels.
Also Read: Bitcoin (BTC) Price Prediction 2026–2030: Can BTC Hit $100,000 Soon?
Key Support Levels Continue Holding
Humanity is currently trading around $0.274 after recovering from recent pullbacks near the $0.25 area. The daily chart highlights immediate support around the 0.618 Fibonacci retracement level at $0.2118, which has consistently attracted buying interest during previous corrections.
Additional support is found near the 0.5 Fibonacci retracement level at $0.1863, closely aligned with the 50-day EMA positioned near $0.1967. This area represents a critical zone that could determine whether the broader uptrend remains intact.
Should selling pressure intensify, the next major support levels emerge near $0.1701 and $0.1448, where the 100-day and 200-day EMAs currently reside. As long as price remains above these levels, the long-term bullish structure remains intact.
Resistance Levels Remain in Focus
On the upside, HUSDT faces immediate resistance near $0.2834, corresponding with recent swing highs and the 0.786 Fibonacci retracement level. A decisive breakout above this zone could open the door for a move toward the Fibonacci extension target near $0.2948.
The daily chart also shows Bollinger Band %B rising sharply toward 0.93, suggesting momentum is strengthening as buyers regain control. Continued accumulation above current levels could support another leg higher.
If bulls successfully clear the $0.295 resistance region, psychological resistance at $0.30 would likely become the next major target. Breaking above that level could significantly improve the long-term outlook.
HUSDT Technical Structure Supports Bullish Outlook
The alignment of the 20-day, 50-day, 100-day, and 200-day EMAs reflects a healthy bullish trend. The 20-day EMA currently sits at $0.2303, while the 50-day EMA remains at $0.1967, both well below the current market price.
This separation between price and moving averages typically indicates strong trend continuation. The fact that buyers quickly stepped in following recent retracements further reinforces the positive market structure. With Fibonacci support levels holding and momentum indicators improving, HUSDT remains positioned for potential upside expansion if broader market conditions remain favorable.
Source: Tradingview
Humanity (HUSDT) Price Predictions (2026–2030)
YearMinimum PriceAverage PriceMaximum Price2026$0.18$0.35$0.602027$0.28$0.55$0.852028$0.40$0.75$1.102029$0.55$0.95$1.402030$0.70$1.20$1.80
Yearly Insights
2026
If current support levels remain intact, HUSDT could challenge the $0.60 region during the next major bullish cycle.
2027
Growing ecosystem adoption and stronger trading activity may support a move toward $0.85.
2028
Sustained market expansion could allow HUSDT to break above the $1 milestone for the first time.
2029
Continued development and broader investor participation may drive prices toward $1.40.
2030
Long-term adoption trends and favorable market conditions could support a climb toward $1.80.
Conclusion
Humanity remains one of the stronger-performing assets on the daily timeframe, with price trading comfortably above all major moving averages and key Fibonacci support levels. The area between $0.2118 and $0.1863 remains crucial for preserving the current bullish structure.
While resistance near $0.2834 and $0.2948 continues limiting immediate upside, a successful breakout above these levels could accelerate momentum toward the psychological $0.30 mark and beyond. As long as HUSDT maintains support above its major moving averages, the broader outlook remains constructive for higher prices in the coming years.
FAQs
Immediate support is located near $0.2118, with additional support around $0.1863.
2. What is Humanity’s major resistance zone?
Key resistance is found between $0.2834 and $0.2948.
3. What does the chart indicate currently?
The chart suggests a bullish trend with buyers maintaining control above key moving averages.
4. What is the projected average HUSDT price for 2026?
The projected average Humanity price for 2026 is approximately $0.35.
5. Can Humanity reach $1?
A sustained breakout above major resistance levels and continued adoption could support a move toward $1 in the coming years.
Also Read: Collector Crypt (COL) Price Prediction 2026–2030: Can COL Hit $1 Soon?
The post Humanity (HUSDT) Price Prediction 2026–2030: Can HUSDT Hit $1 Soon? appeared first on 36Crypto.