The token trades at $54 after reaching a daily low of $52.8, extending the weakness identified when our previous analysis flagged the loss of $57. That placed HYPE roughly 0.6% above the supp
The token trades at $54 after reaching a daily low of $52.8, extending the weakness identified when our previous analysis flagged the loss of $57.
That placed HYPE roughly 0.6% above the support shelf near $52, where the price stabilized on June 11.
Futures and spot flows began moving differently as HYPE approached that level. Leveraged traders rapidly reduced exposure, while most of the latest spot demand appeared during the final four hours. The combination suggests that some buyers were willing to absorb supply near the lower end of the June range, although the amount remains too small to confirm a reversal.
Key Takeaways
- Futures flows swung from approximately $1.53 million in net inflows to $13.4 million in net outflows as leveraged traders cut exposure.
- Roughly 91% of the 12-hour net spot inflow arrived during the latest four hours as HYPE moved closer to support.
- Spot demand may help stabilize the price, but HYPE must reclaim the $57 area before the short-term structure begins to improve.
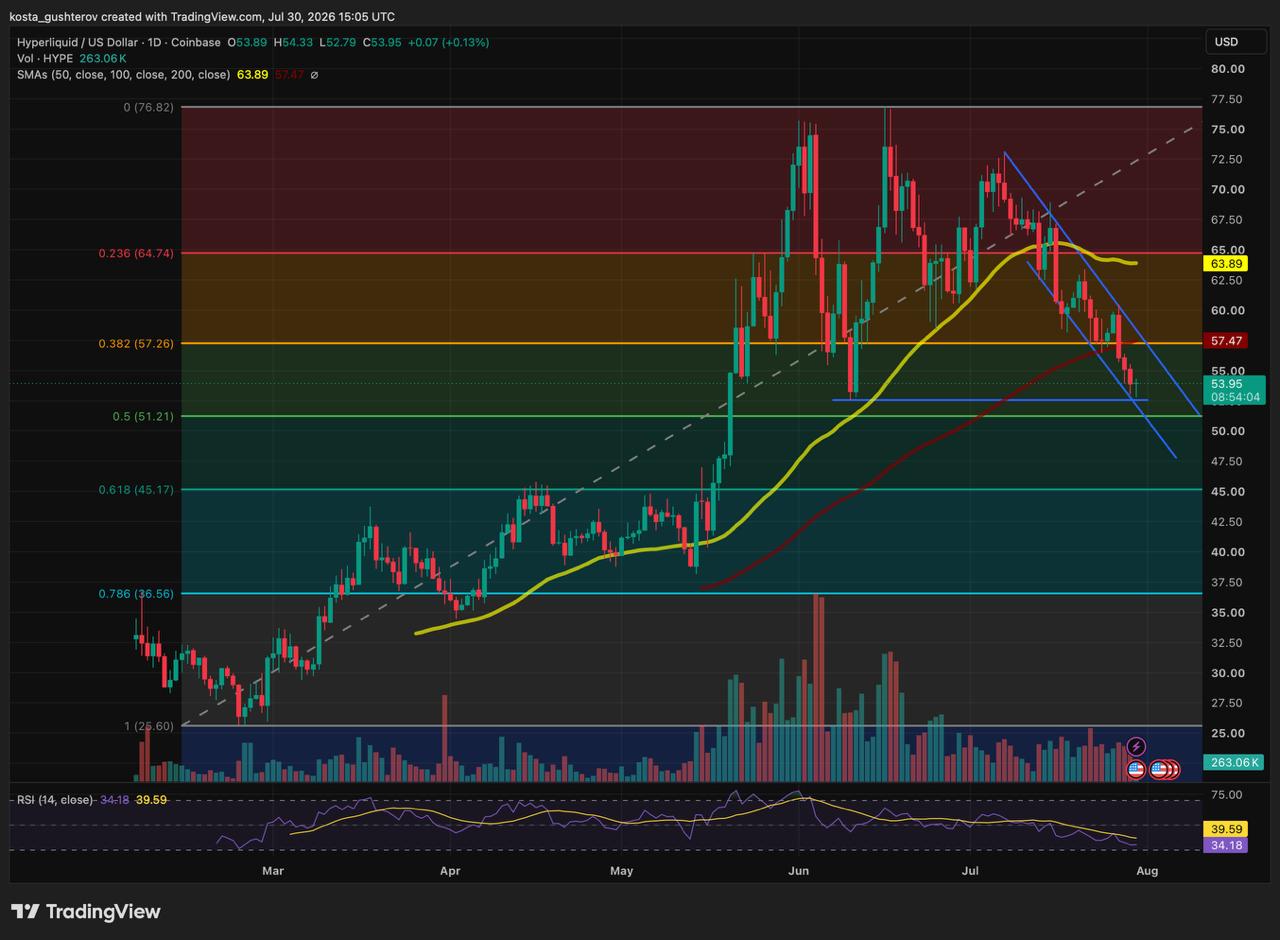
Daily Hyperliquid
(HYPE) technical chart testing June’s lowest level.
Futures Traders Reversed Their Positioning
CoinGlass recorded $11.87 million in net futures outflows over the latest 12 hours. The eight-hour figure was even more negative at $13.4 million.
Since the shorter window contained a larger outflow, the earliest four hours of the 12-hour period must have produced approximately $1.53 million in net inflows.
Positioning then changed quickly. Futures recorded about $6.47 million in net outflows during the following four-hour block and another $6.93 million during the latest four hours.
Liquidation data shows that bullish traders absorbed most of the damage. Of the $3.49 million in HYPE positions liquidated over 24 hours, approximately $3.37 million came from longs.
The liquidations appear to have followed the price decline. Once they began, however, forced closures likely added pressure by automatically selling leveraged long positions into an already weakening market.
The figures show that traders initially increased leveraged exposure but began cutting positions aggressively when HYPE continued lower.
Spot Demand Strengthened Near Support
Spot activity developed differently.
HYPE recorded approximately $503,000 in net spot inflows over 12 hours. Around $458,000 arrived during the latest four hours, accounting for roughly 91% of the total.
The preceding four-hour block had recorded approximately $349,000 in net outflows. Buying therefore strengthened only after HYPE moved closer to the June support area.
This can make the market less vulnerable to another liquidation-driven move. Spot purchases do not carry the same forced-closing risk as leveraged futures positions, giving the price a more stable source of demand.
The inflow remains modest and has not pushed HYPE back above any major resistance. It does show, however, that buyers began responding near the bottom of the June range instead of allowing the decline to continue without resistance.
The regulated investment market didn’t provide any support.
SoSoValue data shows that HYPE spot ETFs recorded $8.78 million in net outflows on July 29, following another $1.24 million of withdrawals on July 28. Combined outflows reached $10.02 million across the two sessions.
ETF activity remains small compared with HYPE’s broader spot, onchain and derivatives markets, so these withdrawals were unlikely to be the main cause of the decline.
They still provide useful context. ETF investors were reducing exposure as HYPE approached support, leaving buyers in native crypto markets to defend the June floor.
READ MORE:
 Stablecoins Could Change How European Banks Fund Loans
HYPE Is Testing the June Support Shelf
The daily low of $52.8 stopped slightly above the flat support near $52, keeping the June base intact for now.
A confirmed daily close below this area would break the consolidation floor and expose the 0.5 Fibonacci retracement near $51. If that level also fails, the deeper 0.618 retracement around $45 would become the next major support.
The first meaningful recovery test sits near $57, where the 0.382 Fibonacci retracement and the 100-day simple moving average are currently positioned. Since HYPE recently lost this area, buyers would need to establish daily price acceptance above it rather than produce only a brief intraday move.
The broader trend remains bearish. HYPE trades below its 50-day SMA around $64 and the 0.236 Fibonacci retracement near $65, while the descending sequence of July highs remains intact.
The late spot inflow could help stabilize HYPE above the June shelf, particularly if futures outflows begin to slow.
A relief bounce toward $57 is possible while support holds, but it would not change the broader downtrend. Reclaiming that area on a daily closing basis would provide the first sign that buyers can sustain demand beyond immediate support.
For now, the flow data points to possible stabilization rather than a confirmed reversal.
- Disclaimer: This article is for informational purposes only and does not constitute financial or investment advice. Technical levels, ETF flows, liquidations and market positioning do not guarantee future price performance.
- Methodology: The analysis uses the HYPE/USD daily chart dated July 30, 2026, SoSoValue spot ETF flow data through 2026, SoSo July 29, and CoinGlass spot flows, futures flows and liquidation data recorded on July 30.
The post HYPE Slipped to $53 Support – Are Buyers Strong Enough to Hold? appeared first on Coindoo.