What to Know Kinesis Gold trades near $121.75, below its Bollinger Band midline, reflecting continued selling pressure despite recent attempts at recovery. KAU’s RSI stands at 45.86, indicati
What to Know
-
Kinesis Gold trades near $121.75, below its Bollinger Band midline, reflecting continued selling pressure despite recent attempts at recovery.
-
KAU’s RSI stands at 45.86, indicating weak momentum, while remaining above oversold territory and suggesting potential for price stabilization.
-
Breaking above $129.94 could strengthen KAU’s recovery toward $140 and $150, while losing $117.06 would increase downside risks significantly.
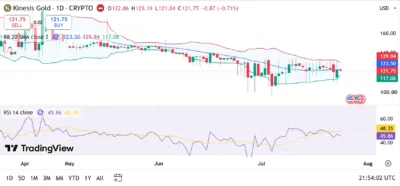
Kinesis Gold (KAU) trades near $121.75, with its daily chart showing persistent bearish pressure following a gradual decline from April’s higher trading levels. According to TradingView, KAU remains below its 20-day Bollinger Band average at $123.50 and the upper band at $129.94.
Recent candles indicate that buyers are attempting to stabilize prices around $120, although resistance near the middle Bollinger Band continues limiting upward movement. The broader chart shows a transition from elevated trading levels toward consolidation.
The Relative Strength Index stands at 45.86, below its moving average at 48.35 and the neutral threshold of 50. These readings indicate relatively weak buying momentum without confirming oversold conditions. KAU is a gold-backed digital asset within the Kinesis monetary system, representing ownership of one gram of allocated physical gold.
Also Read: Ergo (ERG) Price Prediction 2026–2030: Can ERG Hit $0.50 Soon?
Market Structure and Price Action
Kinesis Gold’s chart shows elevated trading activity during March and April, with prices reaching above $160 before entering a sustained downward trend. Selling pressure gradually pushed KAU toward $140 through May and June.
The decline accelerated toward late June and early July, when several volatile candles pushed prices near $100 before buyers initiated a recovery. Subsequent trading activity brought KAU back toward $120–$125, where consolidation developed.
Recent candles indicate that sellers continue defending resistance around $123.50, while buyers are attempting to maintain support above $117.06.
The lower Bollinger Band at $117.06 provides an important support reference. Holding this region could support price stabilization, while a sustained breakdown would expose lower trading levels around $110 and $100.
A stronger bullish continuation would require KAU to reclaim $123.50 and overcome resistance at $129.94. Sustained trading above these levels could support an advance toward $140, with $150 representing a more ambitious recovery target.
Bollinger Bands Indicate Persistent Selling Pressure
KAU trades below its Bollinger Band midline at $123.50, suggesting sellers retain a modest advantage within the short-term market structure. The middle band remains an important reference for determining whether buying momentum can strengthen. A sustained move above $123.50 would indicate improving price strength and potentially expose the upper Bollinger Band at $129.94.
Breaking above $129.94 could strengthen bullish expectations and open the possibility of challenging $140. Reaching $150 would require an advance of approximately 23.2% from the displayed price. Conversely, continued rejection near the middle band could push KAU toward $117.06, where additional selling pressure would increase the likelihood of a deeper correction.
RSI Signals Weak Buying Momentum
The RSI reading of 45.86 indicates moderately bearish momentum, with sellers maintaining an advantage over buyers. Its position below the 48.35 moving average reinforces the cautious short-term outlook.
An RSI recovery above 50 would suggest improving buying interest, while an advance toward 60 could indicate strengthening bullish momentum. Conversely, a decline toward 40 or below would indicate increasing selling pressure, potentially exposing KAU to further downside movement. The RSI remains above the conventional oversold threshold of 30, meaning the indicator does not currently suggest extreme selling conditions.
Source: TradingView
KAU Price Predictions (2026–2030)
Year
Minimum Price
Average Price
Maximum Price
2026
$100
$125
$150
2027
$105
$140
$175
2028
$115
$155
$195
2029
$125
$175
$220
2030
$140
$195
$250
Yearly Insights
2026
KAU’s remaining 2026 outlook depends on maintaining support around $117.06 and overcoming resistance near $129.94. A sustained breakout could support an advance toward $140–$150, while renewed selling pressure could expose the $100 region.
2027
Improving gold market conditions and stronger buying demand could support a recovery toward $175 under favorable circumstances. Establishing support above $140 would strengthen this scenario, although weaker demand could restrict prices to lower trading ranges.
2028
A broader expansion in gold demand could allow KAU to challenge $195. Reaching this level would require sustained buying pressure, favorable gold prices, and continued participation in the Kinesis ecosystem.
2029
The bullish scenario places KAU near $220 if stronger gold market performance supports higher valuations. Unfavorable market conditions or declining demand could instead produce prolonged consolidation around substantially lower prices.
2030
A favorable long-term scenario allows KAU to approach $250, supported by higher physical gold valuations and sustained demand for gold-backed digital assets. Nevertheless, the supplied daily chart does not establish technical confirmation or a reliable timetable for reaching this valuation.
Conclusion
Kinesis Gold shows relatively weak momentum, with its price trading below the Bollinger Band midline at $123.50 and RSI standing at 45.86. Recent candles suggest buyers are attempting to stabilize prices, making resistance near $129.94 an important level.
Breaking above this resistance could support a challenge of $140, followed by the psychological $150 target. Conversely, losing support around $117.06 would weaken the recovery outlook and increase the possibility of a deeper correction.
FAQs
1. What is the immediate support level for KAU?
The nearest support reference is the lower Bollinger Band at approximately $117.06, followed by potential support around $110 and $100.
2. What is the next major resistance for KAU?
The Bollinger Band midline at $123.50 represents immediate resistance, followed by the upper band at $129.94 and potential targets around $140 and $150.
3. What does KAU’s RSI indicate?
The RSI reading of 45.86 indicates moderately bearish momentum. It remains below the neutral threshold of 50 but above the conventional oversold level of 30.
4. Can KAU reach $150 before 2030?
KAU could reach $150 under favorable gold market conditions, although achieving this target would require sustained buying pressure and a breakout above current resistance levels.
Also Read: Hydration (HDX) Price Prediction 2026–2030: Can HDX Hit $0.01 Soon?
The post Kinesis Gold (KAU) Price Prediction 2026–2030: Can KAU Hit $150 Soon? appeared first on 36Crypto.