LAB is a trading and portfolio ecosystem token offering multi-chain trading, staking, and rewards, according to its own project materials. This LAB Price Prediction looks at whether $LAB can
LAB is a trading and portfolio ecosystem token offering multi-chain trading, staking, and rewards, according to its own project materials.
This LAB Price Prediction looks at whether $LAB can break out of its current consolidation range over the next one to two weeks, a case that would be invalidated by a confirmed close below $0.14283.
Here's what's driving the buzz and what the charts say next.
LAB Price Prediction Today: Market Overview
Metric
Value
Price
$0.15006
Market Cap
$68.3M (+3.05%)
Unlocked Market Cap
$73.43M
24h Volume
$19.7M (+120.55%)
Vol/Mkt Cap (24h)
28.91%
FDV
$150.1M
Liq/Mkt Cap
2.71%
Total Supply
989.99M LAB
Max Supply
1B LAB
Total Holders
28.01K
Source: Data from CoinMarketCap as of 1/08/2026. Figures may vary slightly across other tracking websites.
LAB crypto news: LAB Buyback Buzz: What the Post Claims
A widely shared post claims $LAB has generated over $12M in cumulative fees, with 22.68M LAB bought back and 1% of total supply already burned, framing this as evidence of real product usage rather than announcement-driven hype. 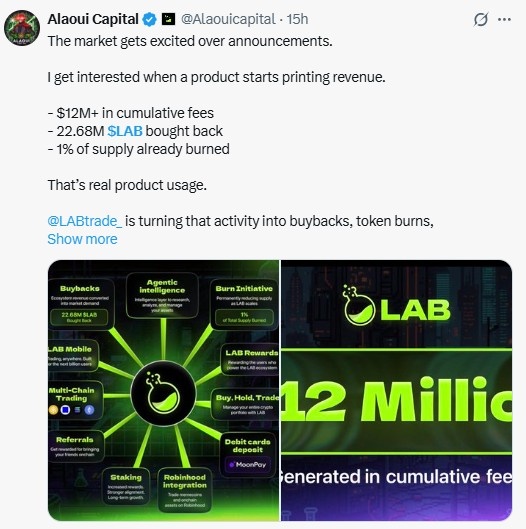
Source: Data From X
The post doesn't document the pool, chain, measurement method, or date behind these figures, and CoinGabbar could not independently verify them.
Readers should treat the fee, buyback, and burn numbers as unconfirmed claims from this post rather than verified on-chain data.
LAB Liquidation and Volume Data
$LAB's futures market shows a mixed liquidation picture across timeframes, per Coinglass.
The 1h window ($1.67K total) was long-heavy ($1.59K longs vs $78.40 shorts), and the 4h window ($27.78K total) followed the same pattern ($27.71K longs vs $78.40 shorts), both suggesting leveraged longs got forced out during a quick pullback. 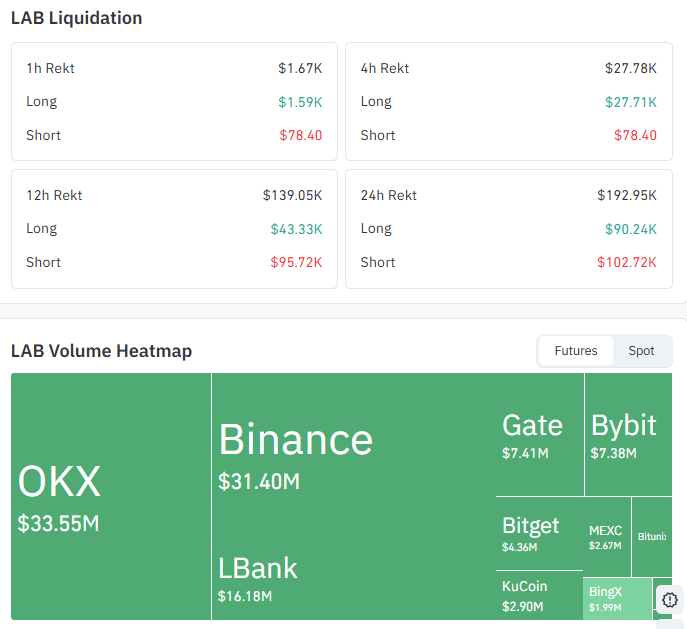
Source: Data From CoinGlass
The 12h ($139.05K total) and 24h ($192.95K total) windows lean the other way, with shorts taking a bit more of the total ($95.72K and $102.72K, respectively against $43.33K and $90.24K in longs), pointing to a more balanced, two-way liquidation flow over the full day rather than a clean directional squeeze.
On futures volume, OKX ($33.55M) and Binance ($31.40M) lead, followed by LBank ($16.18M), with smaller volume spread across Gate, Bybit, Bitget, MEXC, KuCoin, BingX, and Bitunis.
This futures data is kept separate from the $19.7M spot volume figure in the market overview above.
LAB Prediction Chart: Technical Analysis
Pair: $LAB/USDT · Market: Spot (Crypto) · Exchange: KuCoin · Timeframe: 4H · Source: TradingView · Timestamp: August 1, 2026, 13:59 UTC+5:30
$LAB trades at $0.15006; the price broke out of a multi-day descending channel around July and has been consolidating in a range roughly between $0.14283 and $0.17554 since, including a sharp wick up to the range top earlier today that has since pulled back.
The EMA 20 ($0.14879) EMA (exponential moving average) readings that weight recent candles more heavily than a simple average sit just under the current price recently reclaimed. The EMA 50 ($0.19185) sits well above and remains unreclaimed.
RSI (14), the Relative Strength Index, a momentum gauge reading above 70 as overbought and below 30 as oversold, sits at a neutral 50.89, just above the midline.
If the price breaks the range in either direction, then the key levels to watch. 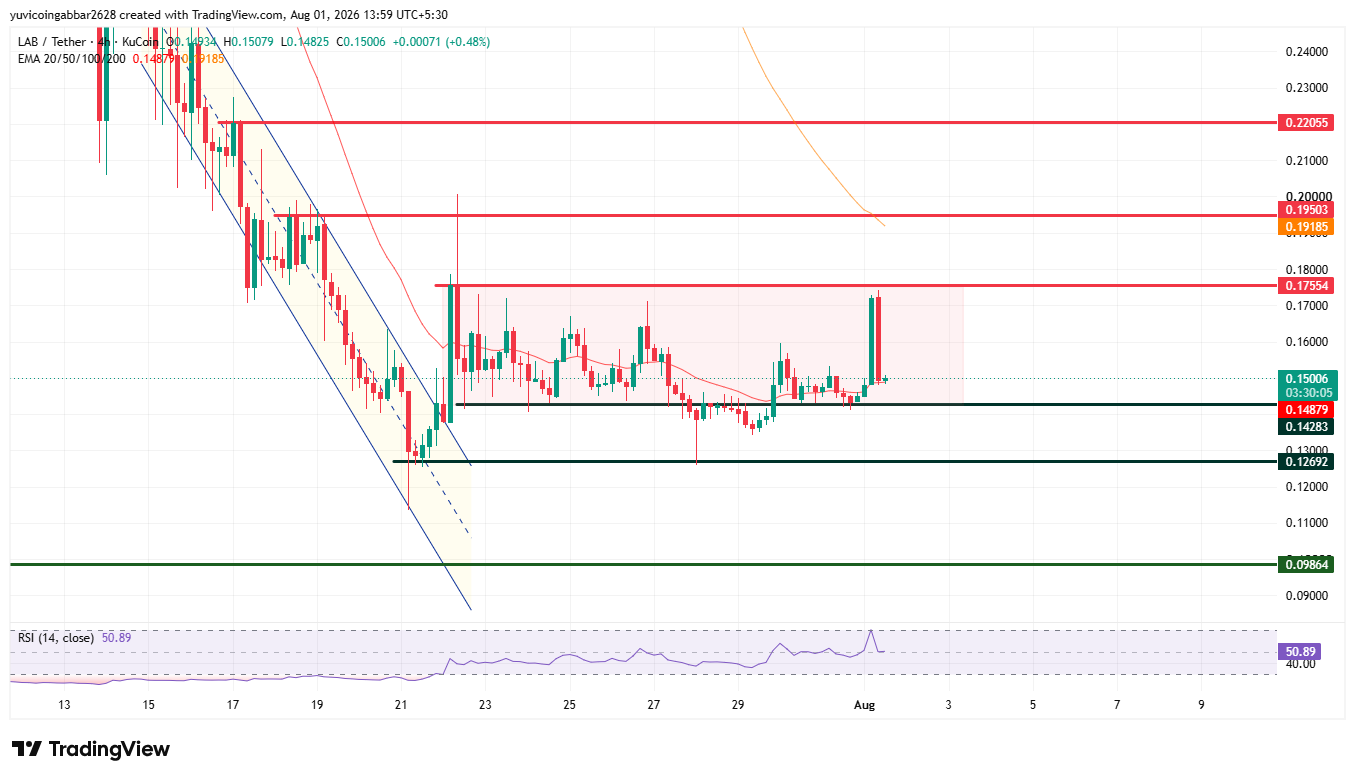
Level Type
Price
Resistance 2
$0.22055
Resistance 1
$0.19503
(EMA 50)
$0.19185
Range top
$0.17554
Immediate Price Reference
$0.15006
(EMA 20)
$0.14879
First Support (range floor)
$0.14283
Deeper Support
$0.12692
Extended Downside Support
$0.09864
LAB Forecast: Bull Case vs. Bear Case
LAB Price Target Bull Case: With the EMA 20 already reclaimed at $0.14879, a break above the range top at $0.17554 would confirm a consolidation breakout, opening a path toward the EMA 50 at $0.19185–$0.19503 and eventually $0.22055 if momentum extends.
The sharp volume spike and today's wick toward the range top suggest buyers are already testing this level.
$LAB Price Target Bear Case: A failure to hold the range floor at $0.14283 would signal the consolidation is breaking down instead, opening $0.12692 first and $0.09864 if the move extends further.
The mixed liquidation picture across timeframes shows the market hasn't fully committed to a direction yet, so a clean breakdown wouldn't be unprecedented.
Can LAB Reach $0.22055?
A move to $0.22055 would be a stretch beyond the near-term bull case.
It would require $LAB to first clear the range ceiling at $0.17554, then break and hold above the EMA 50 cluster near $0.19185–$0.19503, a multi-stage move where each level needs to hold before the next becomes realistic.
What Could Invalidate the Bullish Setup?
A rejection at the range ceiling ($0.17554), followed by a confirmed close below the EMA 20 ($0.14879) and then the range floor ($0.14283), would invalidate the near-term breakout case.
That would open $0.12692 and $0.09864 if the breakdown extends.
LAB Price Prediction Methodology
This forecast draws on multiple inputs rather than a single chart pattern: consolidation range structure, EMA positioning relative to price, RSI momentum, the day's volume spike, mixed liquidation flow across timeframes, and the broader claims circulating about product revenue.
No single input is treated as decisive on its own, and the unverified buyback claims are treated as sentiment context rather than a confirmed fundamental driver.
LAB Price Prediction 2026: Expert View
According to CoinGabbar analysts, LAB's chart shows a genuine structural shift, a breakout of a multi-week descending channel followed by several days of consolidation, with the EMA 20 already reclaimed underneath the current price.
Today's sharp volume spike and the wick toward the range top suggest renewed interest, though the price has pulled back from that high without confirming a breakout yet.
The buyback and burn claims circulating add sentiment tailwind, but without independent verification, they shouldn't be treated as a confirmed fundamental driver behind the move.
LAB Price Prediction: Data Sources
Price and RSI data are referenced from a 4H LAB/USDT chart on KuCoin via TradingView, timestamped August 1, 2026, 13:59 UTC+5:30.
Market cap, volume, FDV, and supply data are referenced from a CoinGecko-style market tracker; snapshot taken August 1, 2026.
Liquidation and futures volume data are referenced from Coinglass as of August 1, 2026. The $12M+ fees, buyback, and burn figures are sourced from a third-party social media post and are unverified.
Disclaimer: This piece is for informational purposes only and isn't financial advice. Crypto prices are volatile, and it's worth doing independent research before acting on any of the levels discussed here.