$META just went on a wild ride, spiking toward $7 before getting slammed back down over 23%, and the Solana futarchy token is once again the talk of the timeline. MetaDAO lets prediction mark
$META just went on a wild ride, spiking toward $7 before getting slammed back down over 23%, and the Solana futarchy token is once again the talk of the timeline.
MetaDAO lets prediction markets, not simple voting, decide governance proposals and fund new "ownership coin" launches, per its own docs.
This MetaDAO Price Prediction breaks down whether META can defend this pullback over the next two to three weeks. Let's look into the charts.
Metric
Value
Price
$5.2803
24h Change
-23%
Market Cap
$120.246M
Fully Diluted Valuation
$120.246M
24h Volume
$12.549M
Total Value Locked (TVL)
$14.135M
Circulating Supply
22.685M $META
Total Supply
22.685M $META
Max Supply
Uncapped
Source: Data from CoinGecko as of 3/08/2026. Figures may vary slightly across other tracking websites.
Pair: METADAO/USD · Market: Spot (Crypto) · Exchange: (unspecified, per chart source) · Timeframe: 4H · Source: TradingView · Timestamp: August 3, 2026, 09:40 UTC+5:30
The 4H chart shows META trading at $5.2803 after a sharp pump-and-fade sequence that peaked near $6.9466 before fading hard.
Price is currently trading above a rising support trendline built from mid-late July's higher highs and lows.
EMA (Exponential Moving Average, a momentum indicator that weights recent candles more heavily) 20 sits at $5.5692, above the current price and not yet reclaimed, while EMA 50 sits at $5.1220, just below the current price.
Separately, a horizontal resistance line at $5.6301 and a support line at $5.0592 mark the nearest chart-based supply and demand zones.
RSI (14), the Relative Strength Index that flags overbought conditions above 70 and oversold below 30, reads a neutral 47.80, showing the sell-off hasn't pushed momentum into oversold territory yet.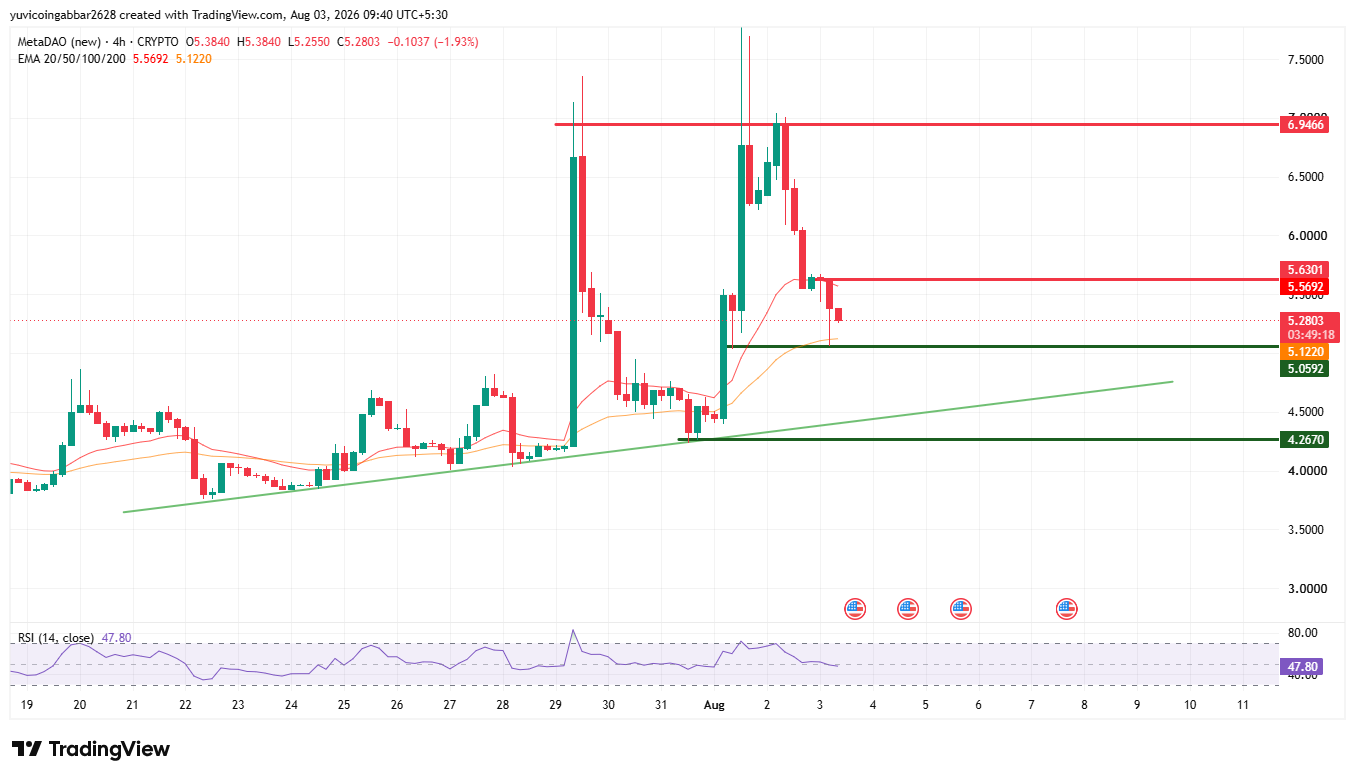
Level Type (Short-Term, 4H)
Price
Resistance 2
$6.9466
Resistance 1
$5.6301
EMA 20
$5.6692
Immediate Price Reference
$5.2803
EMA 50
$5.1220
First Support
$5.0592
Second Support / Deeper Support
$4.2670
Pair: METADAO/USD · Market: Spot (Crypto) · Exchange: (unspecified, per chart source) · Timeframe: 1D · Source: TradingView · Timestamp: August 3, 2026, 09:43 UTC+5:30
Zooming out to the daily chart, META has been carving out a potential rounding-bottom pattern since December 2025, climbing gradually off deep lows before accelerating sharply into a spike toward $10.4598 and now pulling back.
This pattern is not confirmed. A rounding bottom only completes once the price breaks above the $6.5895 resistance zone and sustains that level, which hasn't happened yet.
Price currently sits down 23% on the day, still above EMA 20 ($4.6374) and EMA 50 ($4.0443), all of which are stacked below as a layered support cushion. RSI (14) reads 56.22, mildly bullish, and there is room before it is overbought.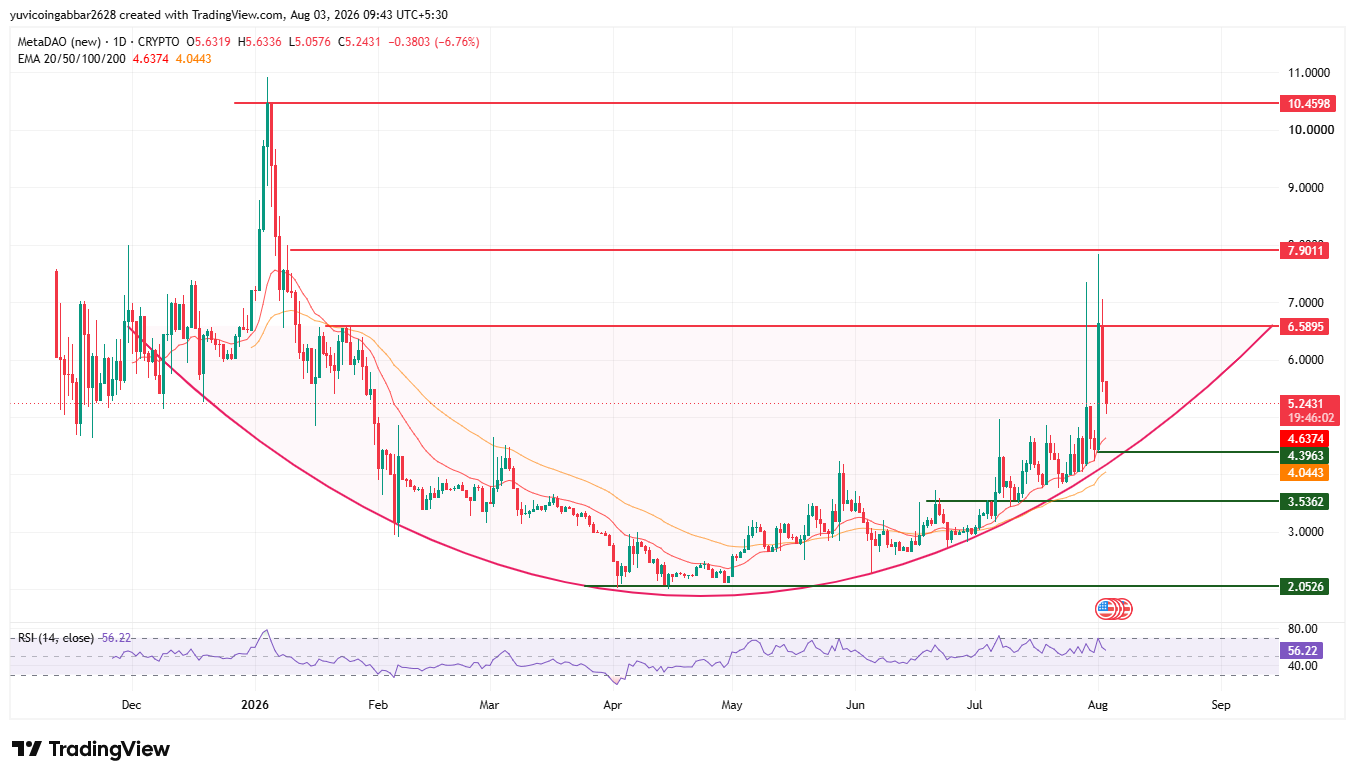
Level Type (Long-Term, 1D)
Price
Resistance
$10.4598
Resistance
$7.9011
Resistance 1 (rounding-bottom confirmation trigger)
$6.5895
(EMA 20)
$4.6374
(EMA 50)
$4.0443
Support
$4.3963
Structural Support
$3.5362
Major Structural Floor
$2.0526
Bull case: Holding the $5.0592 support line keeps the short-term structure intact, opening a retest of the EMA 20/resistance zone near $5.6301-$5.6692.
A daily close above $6.5895, if it sustains, would confirm the rounding-bottom pattern and put $7.9011 in play, with $10.4598 as the stretch level beyond that.
Bear case: A confirmed break below the $5.0592 support line would put short-term structure at risk, with $4.2670 as the next level to defend.
On the daily chart, losing the EMA 50 at $4.0443 would threaten the entire rounding-bottom thesis, opening to $3.5362 and eventually the $2.0526 structural floor.
A measured-move calculation gives a longer-range target beyond the immediate bull case.
Taking the depth of the rounding-bottom pattern, roughly $4.54 between the $2.0526 structural floor and the $6.5895 breakout trigger, and projecting that same distance above the breakout point gives a target near $10.45.
Reaching this would require META to first confirm the daily rounding bottom by breaking and holding above $6.5895, then clear both $7.9011 and the prior spike high at $10.4598 in sequence, a multi-stage move rather than a single leg.
What Could Invalidate the Bullish Setup?
A rejection at the $5.0592 support line followed by a failure to hold $4.2670 would put the short-term recovery attempt in question.
More significantly, a confirmed daily close below the $EMA 50 at $4.0443, and especially a break of the $3.5362 structural level, would undermine the rounding-bottom pattern altogether and shift focus toward the $2.0526 floor.
This forecast is built from multiple inputs rather than a single chart read: short-term and long-term price structure, EMA positioning across both the 4H and 1D timeframes, RSI momentum, the still-unconfirmed rounding-bottom pattern, and the broader context of META's recent spike-and-fade move.
No single signal is treated as decisive on its own, and the measured-move target above is treated as a conditional stretch scenario rather than a base-case expectation.
According to CoinGabbar analysts, META's chart is telling two different stories depending on the timeframe. The daily view shows a constructive, multi-month rounding-bottom structure that's still technically intact despite the recent drop, with price holding above all three key daily EMAs.
The 4H view is messier, showing a sharp spike-and-fade that has knocked short-term momentum back to neutral. The real test is whether buyers can defend the $5.0592-$4.2670 zone on lower timeframes while the bigger daily structure has time to attempt a genuine breakout above $6.5895.
Until that breakout is confirmed, this remains a developing setup rather than a completed one.
Short-term price, EMA, and RSI data referenced from a 4H METADAO/USD chart via TradingView, timestamped August 3, 2026, 09:40 UTC+5:30.
Long-term price, EMA, and RSI data referenced from a 1D METADAO/USD chart via TradingView, timestamped August 3, 2026, 09:43 UTC+5:30.
Market cap, volume, TVL, FDV, and supply data referenced from CoinGecko. Holder count, transfer count, and max supply figures referenced from on-chain explorer data (source pending confirmation).
Disclaimer: This piece is for informational purposes only and isn't financial advice. Crypto prices are volatile, and it's worth doing independent research before acting on any of the levels discussed here.