Is NEAR finally ready to leave its range, or is this another trap? A 10.73% jump in 24 hours has pulled the NEAR price prediction debate back into focus. NEAR price today sits at $5.20 on Oct
Is NEAR finally ready to leave its range, or is this another trap? A 10.73% jump in 24 hours has pulled the NEAR price prediction debate back into focus.
NEAR price today sits at $5.20 on October 21, 2026, at 10:00 UTC, right under the ceiling from theearlier NEAR resistance test. A bounce isn't a breakout.
NEAR Market Snapshot
$NEAR Protocol price data from theCoinMarketCap listing puts $NEAR at rank 16, with price and activity both rising together.
Metric
Value
Price
$5.20
24h price change
+10.73%
Market cap
$6.8B
Fully diluted valuation
$6.8B
24h volume
$1.59B
Volume to market cap
23.18%
Circulating supply
1.3B NEAR
NEAR Business Launch News Explained
$NEAR Business went live on October 20, 2026, around 15:00 UTC, per the official launch post. It's a multisig treasury, so several signers must approve every move.
Teams can pay vendors, swap assets, and allocate capital across 35+ chains. Per thefull launch article, target users are teams, not traders, so price impact stays small.
NEAR ETF Flow Data
Fund flows tell a quieter story. Bitwise's NEAR ETF, ticker NRR, saw a $2.54M net outflow as of October 20, 2026, per SoSoValue ETF data.
One day of outflow doesn't erase $85.93M in cumulative inflows. But net assets are only 1.27% of market cap, and theBitwise NEAR ETF launch coverage adds background.
NEAR Open Interest Trend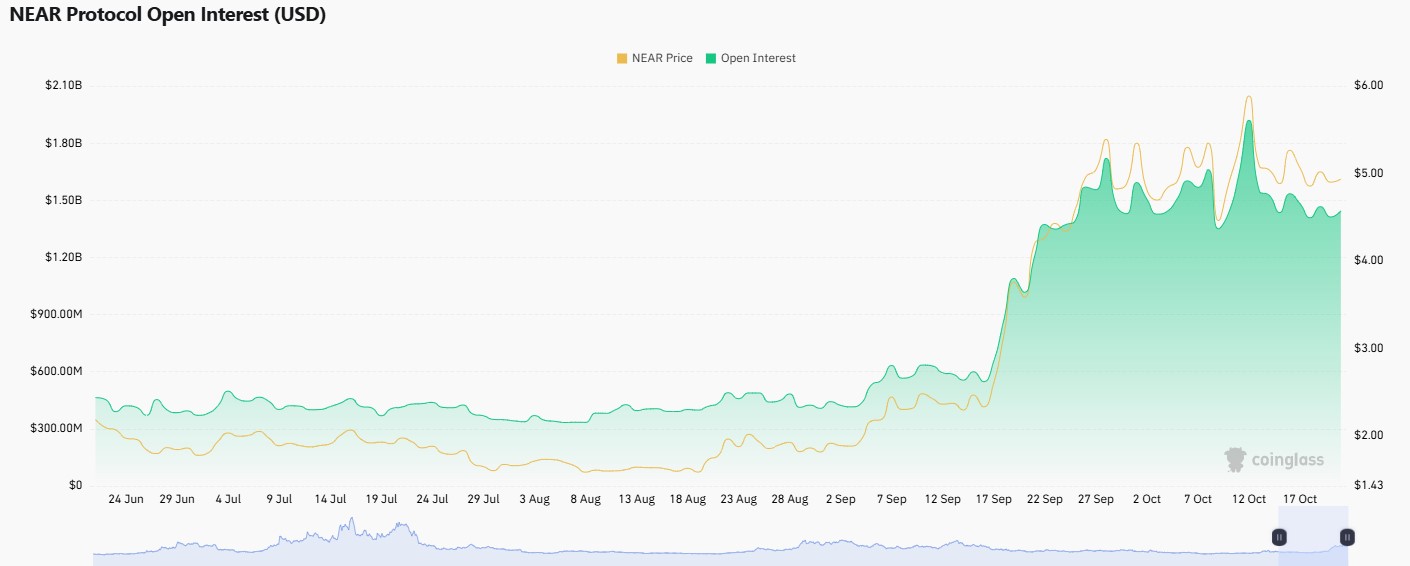
Derivatives tell a louder story as NEAR open interest, the total value of open futures contracts, hovered between roughly $300M and $600M from late June to early September, per Coinglass open interest data.
Then it exploded. Past $1B by mid-September, then near $1.9B around October 12, 2026. Today it sits near $1.45B, about three times summer levels.
Price and open interest climbed together, so borrowed money powered much of the rally. More open bets mean bigger swings both ways, and shorts felt that first.
NEAR Liquidation Breakdown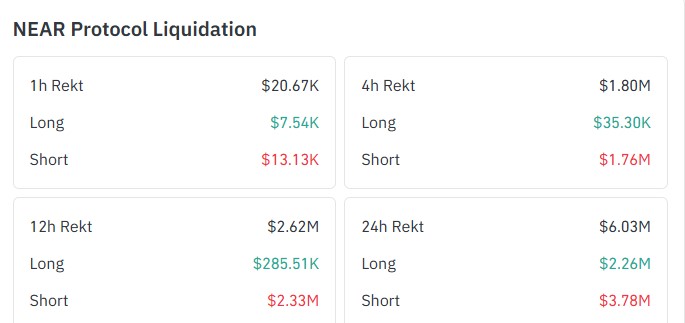
Shorts got crushed as they lost $3.78M in 24 hours, while Longs lost $2.26M. Total $NEAR liquidations hit $6.03M, per CoinGlass liquidation data.
In just four hours, shorts lost $1.76M of the $1.80M total, and forced buying from squeezed shorts pushed the price up. That's a short squeeze. Now it's cooling, with only $20.67K liquidated in the last hour. But shorts still lead.
NEAR Price Analysis on the 4-Hour Chart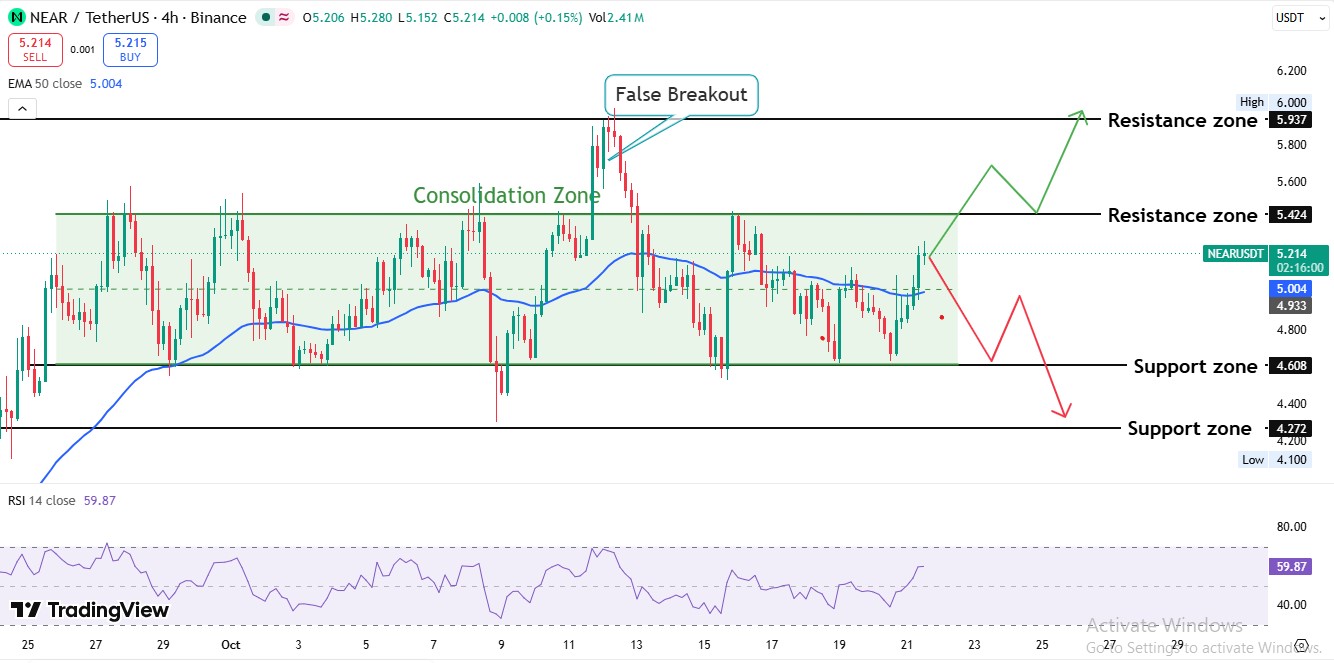
In this $NEAR price analysis, the price has bounced between $4.608 and $5.424 since late September. That's a consolidation zone, a sideways range where buyers and sellers cancel each other out.
Buyers defended $4.608 several times. Sellers pushed back near $5.424 just as often, and that's rejection, where sellers push the price back down.
Right now, the price sits above the midline of the consolidation zone. Where rejection has shown up before, and where buyers need something new.
Around October 11 to 12, 2026, the price pushed above the consolidation zone and reached near $6.00, touching resistance at $5.937.
A false breakout is a fake move. Price jumps above the range, then drops back in. Buyers who jumped in late get stuck and lose money. Will this time be different?
EMA Explained
The 50-period EMA sits at $5.004, and price trades above it, so short-term momentum still bullish.
But the line stayed flat for weeks, a classic sideways sign. And price weaved through it repeatedly. Otheraltcoin chart setups use the same tool for the same reason.
RSI Explained
RSI is at 59.87, so buyers are active, but the price is not overstretched yet. There is still room to climb toward $5.424.
NEAR Support and Resistance Levels
Level
Price
Role
Resistance 2
$5.937
False breakout peak
Resistance 1
$5.424
Top of the range
Support 1
$4.608
Bottom of the range
Support 2
$4.272
Next floor
Price must trade above $5.424 and hold before $5.937; it even matters. Below, $4.608 is the floor buyers keep defending.
NEAR Price Prediction: Bullish, Base, and Bearish Scenarios
Bullish ScenarioIfthe price breaks above $5.424 with strong volume, then it heads to $5.937. If it falls below $5.004, then the setup is invalid.
Base ScenarioPrice retests $5.424, then goes sideways. This holds until the range breaks up or down.
Bear ScenarioPrice drops below $4.608, then heads to $4.272. If it climbs back above $5.004. Then the setup is invalid.
Case
Target
Invalidation
Bull
$5.937
Trades below $5.004
Base
$5.424 retest, then pause
Range breaks either way
Bear
$4.272
Trades back above $5.004
The $NEAR price target of $5.937 needs a push above $5.424 on strong volume. Without it, that's the old trap again. Bear case starts only below $4.608.
NEAR Price Forecast: Expert Outlook
As perCoingabbar analysis, this $NEAR price prediction is kept cautiously bullish. Volume is up 85.38%, there are squeezed shorts, and an RSI at 59.87 favors another test of $5.424.
But the failed push toward $6.00 and the $2.54M ETF outflow keep the $NEAR price outlook in check. A break above $5.424 changes the story.
Buyers have fuel for that move, since shorts lost $3.78M. Still, open interest sits near $1.45B, so a reversal could hurt crowded positions.
Disclaimer: This article is for informational purposes only and isn't financial advice. Cryptocurrency, especially memecoins, is highly volatile and can lose value quickly. Readers should do their own research before making any trading decision.