$SCR is breaking out of the deep slide it has been stuck in since June, and traders are watching closely to see if this is the turn everyone has been waiting for. This Scroll Price Prediction
$SCR is breaking out of the deep slide it has been stuck in since June, and traders are watching closely to see if this is the turn everyone has been waiting for.
This Scroll Price Prediction September 2026 breaks down the September outlook: the bullish case stays alive above $0.021756, and a close above $0.024109 could open the door to a much stronger move up the chart.
Market data was checked on August 27, 2026, at 10:45 IST.
Metric
Value
Price
$0.023068
24h Change
+5%
Market Cap
$4.37M
Unlocked Market Cap
$10.68M
FDV
$23.04M
24h Volume
$4.32M
Vol/Mkt Cap (24h)
97.83%
Total Supply
1B SCR
Max Supply
1B SCR
Circulating Supply
190M SCR
Holders
130.52K
Source: Data from CoinMarketCap as of August 27, 2026, at 10:45 IST. Figures may vary slightly across other tracking websites.
Technical Analysis: Key Support and Resistance $September 2026
Pair: SCR/USDT · Market: Spot (Crypto) · Exchange: Aggregated · Timeframe: 1D · Source: TradingView · Timestamp: August 27, 2026, 10:45 UTC+5:30
SCR closed at $0.023068 after breaking out of the descending channel that had capped the price since mid-June, from lows near $0.019575.
The breakout candle cleared the channel's upper boundary, and the price is now consolidating just below the $0.024109 zone that has acted as resistance since late July.
The resistance is crucial for the rally. A clean break above this level is important for further upside. 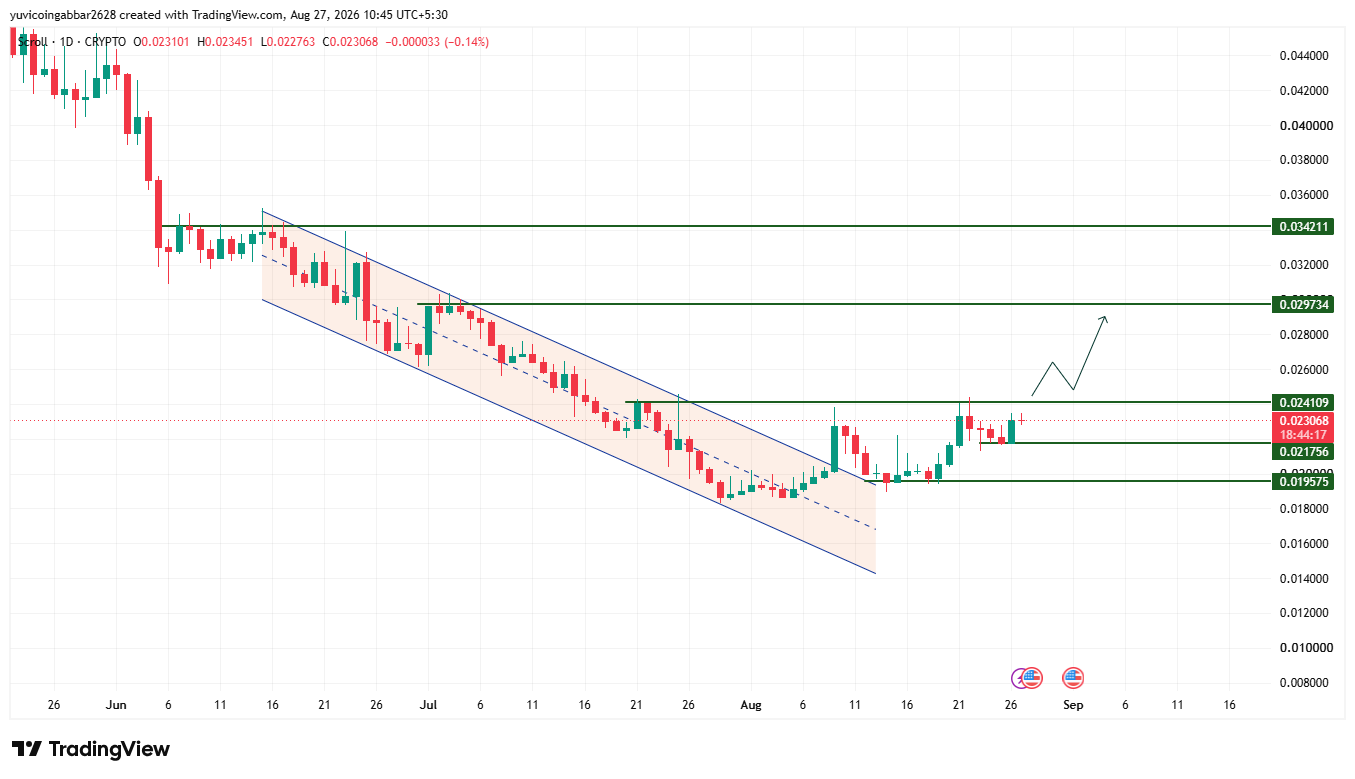
Level Type
Price
Resistance 3
$0.034211
Resistance 2
$0.029734
Resistance 1 (nearest)
$0.024109
Immediate Price Reference
$0.023068
First Confirmed Support
$0.021756
Structural Floor
$0.019575
Bull case: A daily close above $0.024109 would confirm the channel breakout is holding, opening a path toward $0.029734 and eventually $0.034211 if buying pressure keeps building.
Base case: SCR spends $September consolidating between $0.021756 and $0.024109, digesting the breakout before attempting a fresh push higher.
Bear case: Losing $0.021756 would put the breakout in doubt and suggest the recent bounce was a temporary relief move, exposing the structural floor near $0.019575.
Scenario
Trigger
Likely Outcome
Invalidation Point
Channel breakout hold (bullish)
Daily close above $0.024109
Move toward $0.029734, then $0.034211
Close back below $0.022763
Retest and hold
Pullback holds above $0.021756
Stabilization before retrying $0.024109
Break below $0.021756
Range-bound
Price oscillates between $0.021756 and $0.024109
Sideways chop, no clear trend
Break of either boundary
Channel breakdown (bearish)
Daily close below $0.021756
Drop toward $0.019575
Reclaim above $0.021756
Can $SCR Reach $0.034211 in $September 2026?
$0.034211 is the highest resistance level marked on the chart.
Reaching it would require SCR to first clear $0.024109, then hold above $0.029734, a multi-stage move that would likely need sustained volume at each stage rather than one sharp spike.
According to CoinGabbar analysts, the channel breakout is the strongest signal here, but the daily candle is still flat to slightly negative, so confirmation has not fully arrived yet.
The $0.021756 to $0.024109 zone is the real battleground for September: holding above it keeps the bullish case alive, while a fast slip back into the old channel would suggest this bounce was temporary rather than a genuine trend shift.
Disclaimer: This piece is for informational purposes only and is not financial advice. The levels and scenarios above are based on technical chart analysis and publicly available data at the time of writing, and crypto markets can move sharply within hours, so past patterns do not guarantee future outcomes. It is worth doing independent research and considering your own risk tolerance before acting on any of the levels discussed here.