SOL recovered nearly 35% from its recent low, establishing a sequence of higher highs and higher lows. Trading volume increased to over $3.88 billion on the day, with buyers defending the cri
- SOL recovered nearly 35% from its recent low, establishing a sequence of higher highs and higher lows.
- Trading volume increased to over $3.88 billion on the day, with buyers defending the critical $80 support zone.
- Resistance between $82.50 and $84.00 remains the primary hurdle before the $90-$100 targets.
SOL is bouncing back from a recent low, with technical indicators, trading volume, and narratives around the ecosystem pointing to a potential move towards higher resistance levels.
SOL Recovery Establishes Stronger Technical Structure
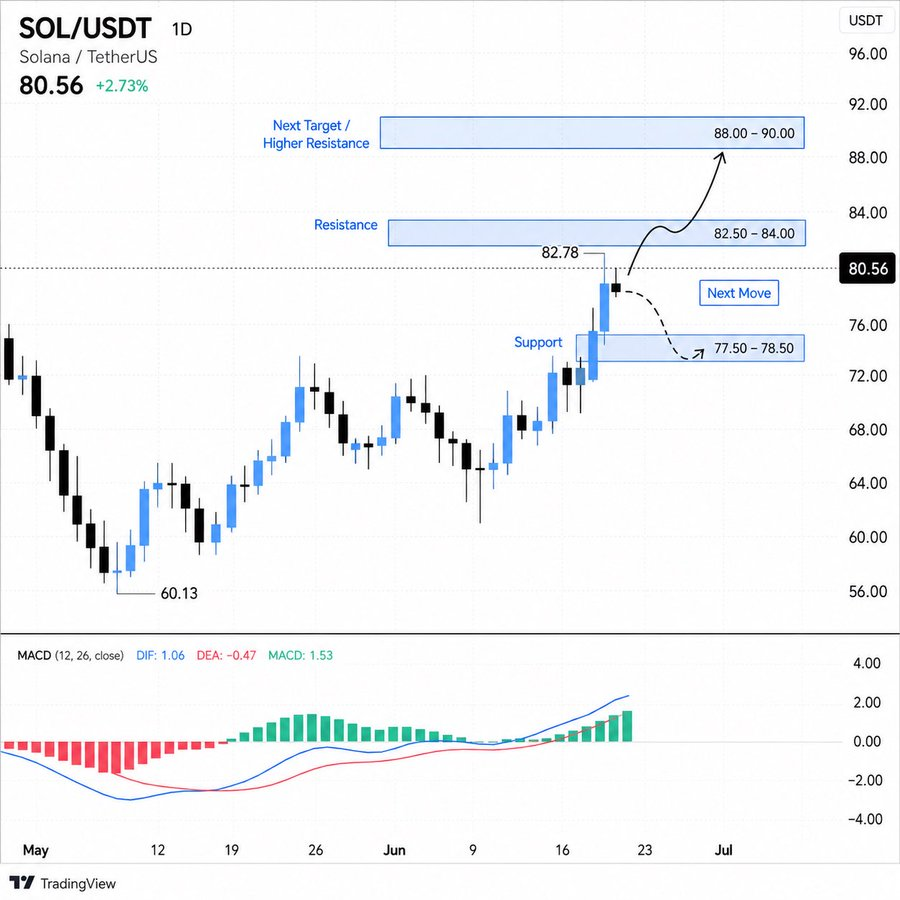
The daily SOL/USDT chart shows a notable shift in market structure. After bottoming near $60.13, SOL established a consistent recovery pattern. Higher highs and higher lows have since defined price action.
Source:
XThe recent advance has allowed SOL to reclaim several resistance levels. This recovery has unfolded gradually throughout June. Market participants have increasingly focused on the strengthening trend structure.
According to commentary shared by BitBull on X, Solana's market narrative continues gaining traction. Fast settlement speeds and low transaction costs remain central themes. Real-world asset adoption also features prominently in current discussions.
The chart identifies the $82.50-$84.00 range as immediate resistance. SOL recently tested the $82.78 level before encountering selling pressure. Such reactions often occur following extended upward movements.
Momentum Indicators Continue Supporting Buyers
Momentum indicators currently favor continued bullish participation. The MACD remains positioned above its signal line. Meanwhile, the histogram continues printing positive values.
The widening separation between MACD indicators suggests buying momentum remains active. Technical traders frequently monitor these conditions closely. Momentum exhaustion signals have yet to emerge clearly.

SOL was trading at approximately $80.98 during the time of writing. The asset recorded a 3.5% daily gain. Trading volume increased to roughly $3.88 billion over the same period.
Volume expansion alongside price appreciation often reflects stronger participation. Solana's market capitalization also increased to approximately $47.05 billion. These metrics collectively indicate improving market engagement.
Resistance Levels May Determine SOL's Path Toward $100
The chart outlines two possible near-term scenarios for SOL. The bulls need to overcome the $82.50 to $84.00 resistance area. A prolonged above this range could help support further upside.
Should buyers maintain control above resistance, the next target emerges near $88-$90. This area represents the next significant supply zone. Market participants may then begin evaluating the psychological $100 level.
Alternatively, failure to break resistance could trigger temporary retracement. Support is identified on the chart between the range of $77.50 and $78.50. This may not necessarily be a signal that the overall trend is over.
Supply metrics continue reflecting Solana's market maturity. Circulating supply currently stands near 581 million SOL. The network's large capitalization and liquidity profile support ongoing price discovery activity.