Quick Summary SOL currently hovers around the $77–$78 range, representing nearly a 30% surge from its $60 June bottom Critical resistance zone positioned between $89–$92; breakthrough could t
Quick Summary
- SOL currently hovers around the $77–$78 range, representing nearly a 30% surge from its $60 June bottom
- Critical resistance zone positioned between $89–$92; breakthrough could trigger rally toward $100 milestone
- SBI Holdings announced strategic collaboration with Solana Foundation to develop on-chain financial infrastructure in Japan
- Network handled more than $4 billion in decentralized exchange transactions within 24 hours, surpassing competing platforms
- Support level at $74–$75 remains crucial; losing this zone could send SOL down to $68.57
Solana has demonstrated a notable rebound during recent weeks, posting approximately 30% gains from its June bottom around $60. Currently, the digital asset trades in the $77–$78 range, maintaining position above an important support level that market watchers are monitoring carefully.
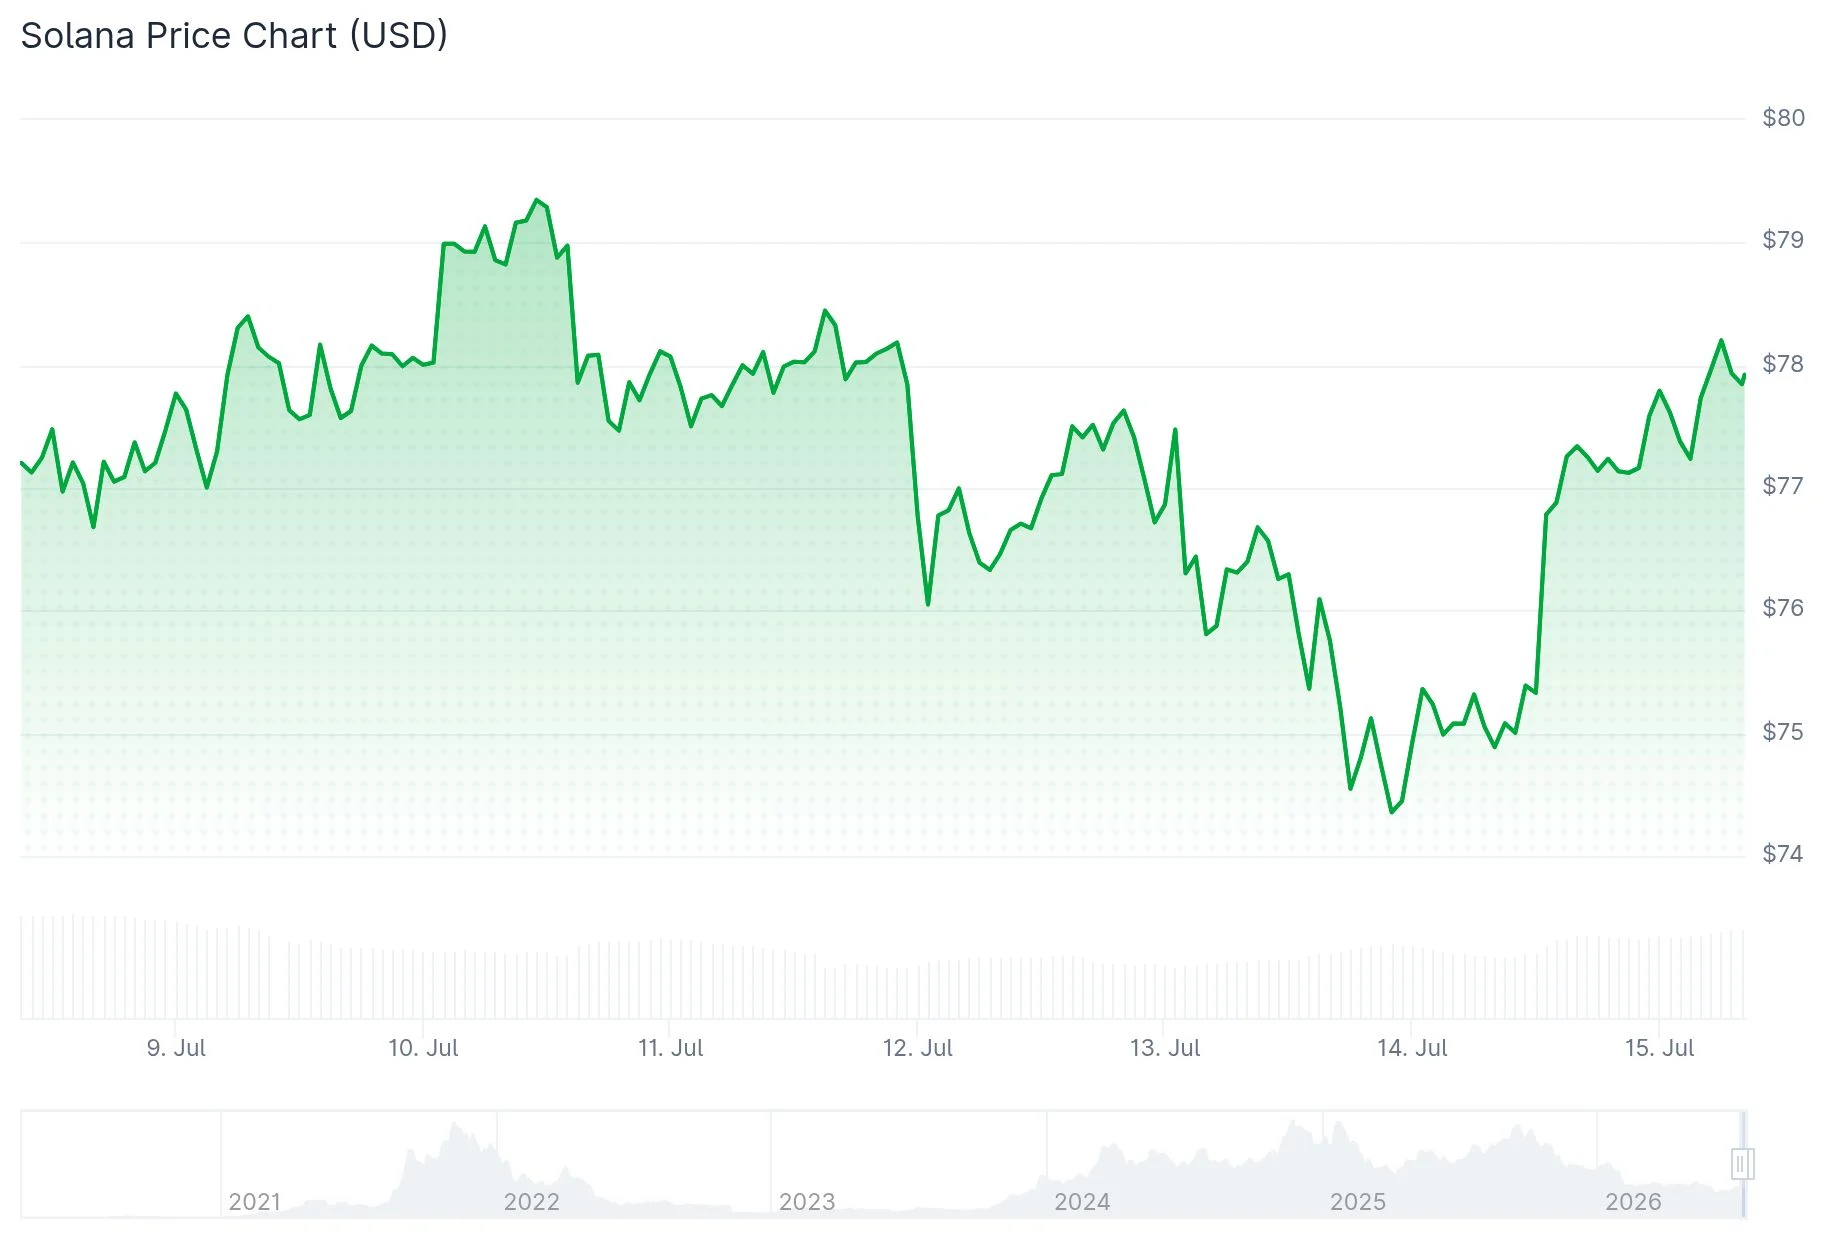 Solana (SOL) Price
The 24-hour trading activity registered $3.87 billion, while the network’s market capitalization stands at approximately $44.79 billion per CoinMarketCap data. Currently, SOL positions itself near the middle Bollinger Band level of $76.73, flanked by an upper band at $84.89 and lower band at $68.57.
Price action shows movement within an upward-sloping channel, establishing consecutively higher peaks and troughs. This technical formation indicates increasing buyer strength, although the advance hasn’t yet penetrated its next significant resistance barrier.
Corporate Partnerships Bolster SOL Outlook
SBI Holdings, a major Japanese financial services firm, has entered a strategic alliance with the Solana Foundation to construct on-chain financial infrastructure. The initiative will concentrate on stablecoin integration, tokenization of real-world assets, and international payment solutions.
This corporate collaboration strengthens Solana’s narrative around institutional acceptance and has helped boost market confidence in the token.
Blockchain metrics support the optimistic outlook. The Solana network facilitated over $4 billion in DEX trading volume during a 24-hour timeframe, outstripping rival blockchain platforms throughout that measurement period.
Market analyst Ali Charts shared on X platform that Solana’s ATR trailing stop indicator has crossed beneath the price level for the first time since October 10, generating a SuperTrend buy indication. Ali Charts mentioned that sustained buying momentum could propel SOL toward $96 or potentially $121, though $60 represents the pivotal downside level—falling below would negate the positive technical setup.
Critical Price Levels Under Observation
Technical analyst BitGuru identified the $74–$75 band as a vital support area on July 14. He emphasized that maintaining above this threshold could facilitate movement toward $80–$84, whereas breaking below would trigger downside pressure on SOL.
The MACD indicator shows a reading of 0.9160, positioned beneath the signal line at 1.2750, producing a negative histogram value of -0.3590. This configuration suggests diminishing momentum in the near term.
The more significant challenge remains the $89–$92 resistance zone, which has repeatedly turned back price advances since March. A decisive breach above $92 would bring the $100 psychological level directly into focus.
SOL is currently trading at $77.01, up 1.74% in the past 24 hours.
The post Solana (SOL) Price Eyes $100 Target Following Strong 30% Recovery Rally appeared first on Blockonomi.
 (@bitgu_ru)