Solana’s 3-day chart has printed a new SuperTrend buy signal, marking the first such flip since Oct. 10. The SuperTrend signal appeared after the Average True Range trailing stop moved beneat
Solana’s 3-day chart has printed a new SuperTrend buy signal, marking the first such flip since Oct. 10.
The SuperTrend signal appeared after the Average True Range trailing stop moved beneath SOL price action. Traders use that shift as a trend-following marker because the indicator turns bullish when price holds above its volatility-adjusted stop level.
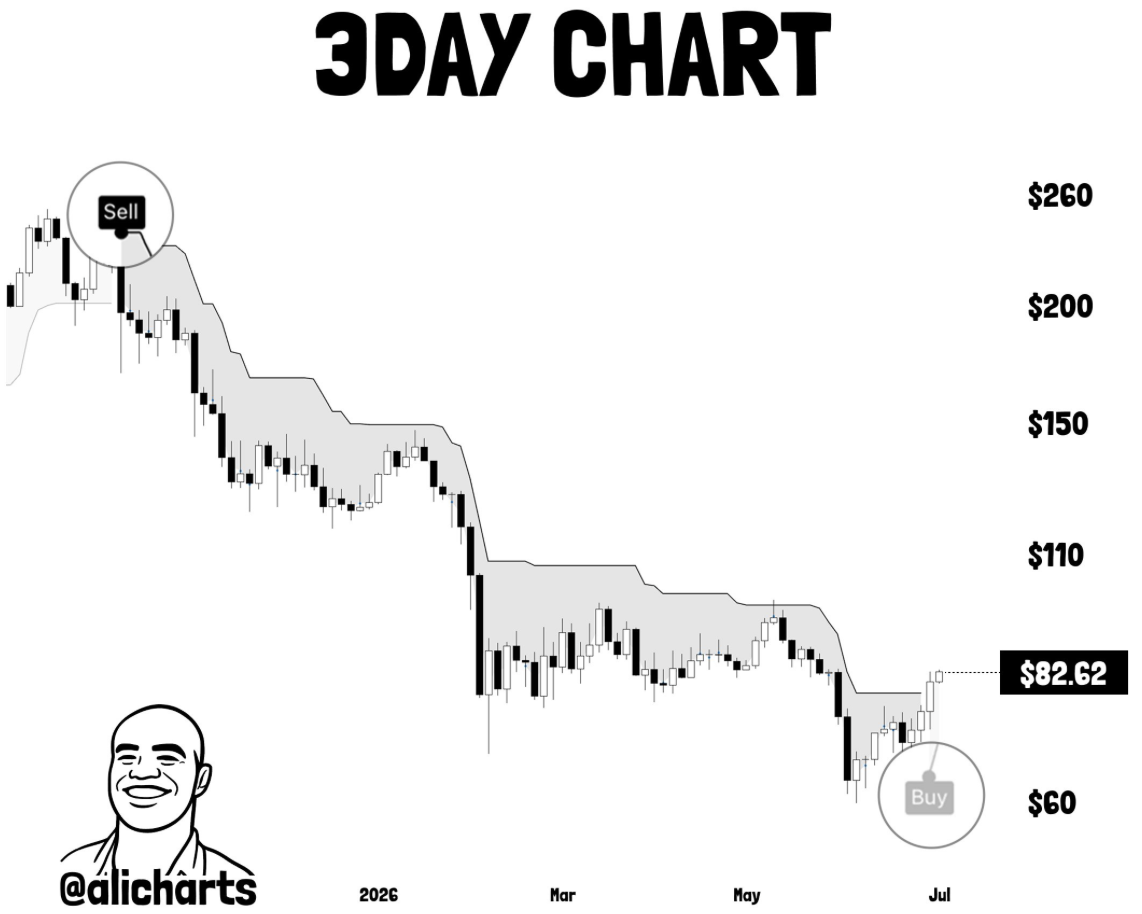
Source: @alicharts via X
The previous SuperTrend sell signal was followed by a 74% correction, making the new flip notable for traders watching whether Solana’s downtrend has exhausted. The signal does not guarantee a rally, but it changes the technical setup from defensive to recovery-focused.
The next target being watched is the $100 area. For that move to hold, SOL would need follow-through above short-term resistance, stronger spot volume and a cleaner market structure rather than only one indicator flip.
Derivatives Positioning Has Already Picked Up
The SuperTrend signal arrives after Solana derivatives activity started to rebuild.
SOL open interest recently reached a five-week high as traders added exposure while tokenized-equity activity kept the network in focus. Open interest can support a stronger move when price follows, but it also raises liquidation risk if leveraged positioning becomes crowded.
That makes the SuperTrend flip more useful as a confirmation point than a standalone trigger. A sustained push toward $100 would need price strength to absorb leverage and prevent a fast unwind.
Solana has also been gaining attention from tokenized-market activity. Tokenized equity volume on Solana recently hit about $380 million as xStocks and Backpack-led trading turned real-world market exposure into one of the chain’s faster-moving categories.
Trend Flip Still Needs Follow-Through
The bullish case depends on whether SOL can maintain the new SuperTrend structure on the 3-day chart.
A close back below the trailing stop would weaken the signal and turn the move into another failed rebound. Holding above it would keep the trend flip active and leave $100 as the next major area traders are watching.
The setup also comes while Solana’s market narrative is broader than price alone. Recent Solana activity spans tokenized equities, stablecoin settlement, derivatives positioning and renewed institutional attention, giving traders more catalysts than a simple oversold bounce.
As of July 5, the 3-day SuperTrend had flipped to a buy signal for the first time since Oct. 10, with SOL traders watching whether the move can extend toward $100.
The post Solana SuperTrend Flips Buy For First Time Since October appeared first on Crypto Adventure.