XLM has spent weeks giving traders very little to work with, but that quiet stretch may be getting harder to ignore. Price is tightening on the shorter chart while Stellar keeps adding real-w
XLM has spent weeks giving traders very little to work with, but that quiet stretch may be getting harder to ignore.
Price is tightening on the shorter chart while Stellar keeps adding real-world financial use cases away from the market.
The combination does not guarantee a breakout, but it gives the next Stellar Price Prediction move more context than price action alone.
Why Is Stellar Gaining Attention in the Crypto Market?
The latest data on coinMarketCap $XLM at $0.1850, down 2.59% over 24 hours, with a market cap of $6.32 billion and daily volume of $144.2 million.
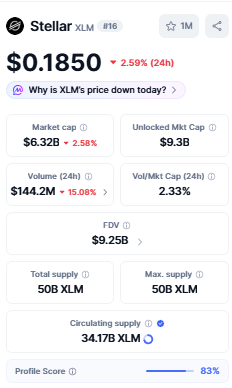
Performance has remained uneven, with $XLM down 2.25% over seven days and 9.19% over 30 days, although the 90-day return remains positive at 4.90%.
Away from price, the Stellar network has a fresh institutional catalyst. Tradable announced an integration to tokenize up to $1 billion in private credit assets on Stellar, adding another real-world asset use case to the network's financial infrastructure.
What Does the Four-Hour XLM Chart Show?
The four-hour TradingView chart shows $XLM compressing inside a symmetrical triangle, with price around $0.18513 and the range
narrowing toward its apex. The immediate upside level is $0.19345. A confirmed move above the pattern could bring $0.20855 and $0.21631 into view, with $0.23395 marked higher on the chart.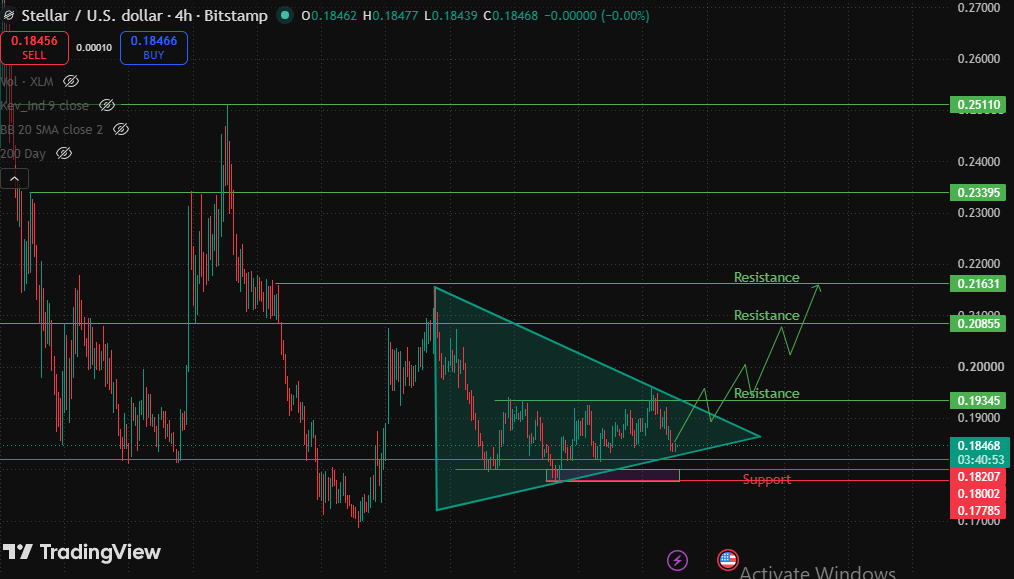 On the downside, the nearby support zone runs through $0.18207, $0.18002 and $0.17785. Until price leaves the triangle with confirmation, the setup remains balanced rather than clearly bullish or bearish.
How Does the Daily Stellar Chart Change the Picture?
The daily TradingView chart tells a broader story. XLM has moved beyond the descending trendline drawn from the previous major high, but price is still consolidating close to the $0.18 area rather than extending into a sustained recovery.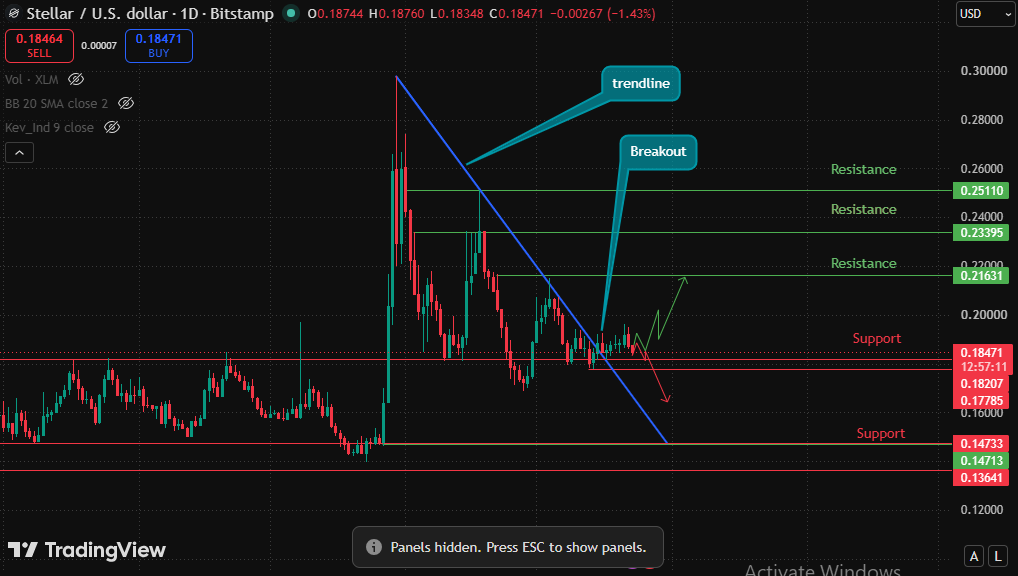
For the larger structure, $0.21631 is the first major resistance, followed by $0.23395 and $0.25110. If the current base fails, $0.18207 and $0.17785 remain the first supports, while the deeper chart zone around $0.14733 to $0.13641 becomes relevant only if broader weakness develops.
Is Stellar Network Adoption Supporting the Longer-Term Story?
Stellar's fundamental story is increasingly tied to payments and tokenized assets.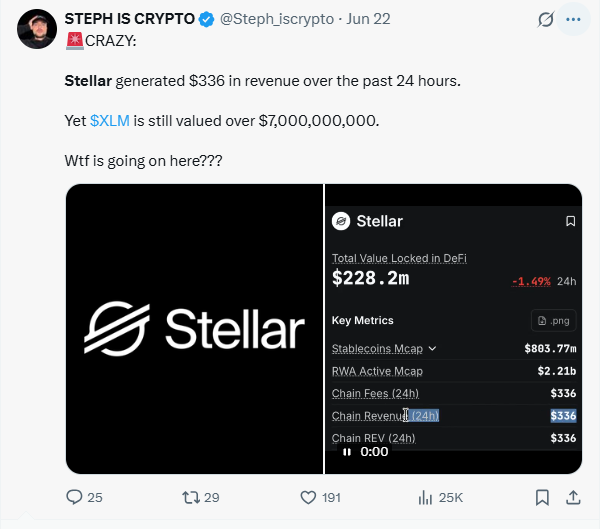
Alongside the planned Tradable integration, the Stellar Development Foundation and UNDP extended their partnership in July to move proven blockchain-based payment pilots toward infrastructure that can be used more regularly across UNDP programmes.These developments do not determine XLM's next candle, but they strengthen the network's real-world utility narrative while the token itself remains in a technical decision zone.
What Does XLM Open Interest Say About Trader Positioning?
Stellar Open Interest stands at $192.91 million on the coinGlass web
The longer chart shows OI well below earlier peaks, although participation has recovered from previous low periods.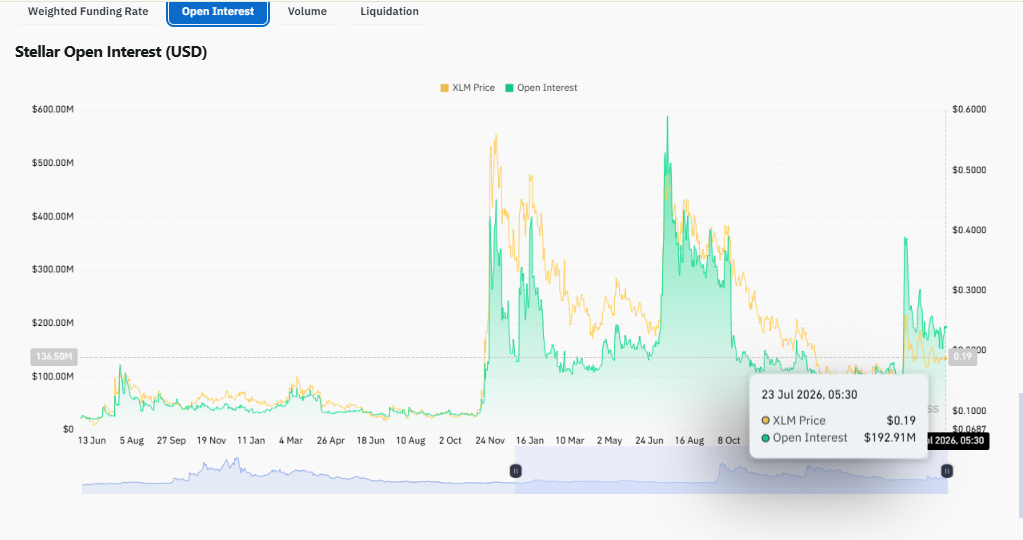
That leaves leverage active without returning to the extremes seen during stronger speculative phases.The futures volume heatmap is led by Binance at $62.47 million, followed by MEXC at $34.98 million and Bybit at $21.91 million.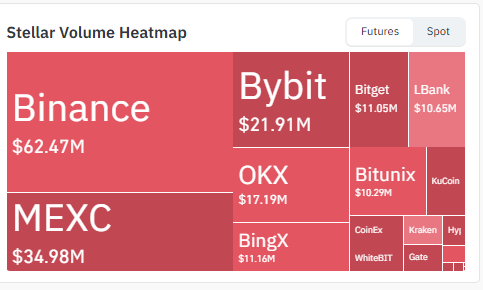
The data shows meaningful derivatives activity, but not enough on its own to confirm which side will control the next breakout.
What Are XLM Liquidations Showing?
The latest 24-hour liquidation shows on coinglass.com $274.88K in total liquidations, including $248.70K from longs and $26.18K from shorts.
Over 12 hours, liquidations reached $241.90K, again dominated by long positions.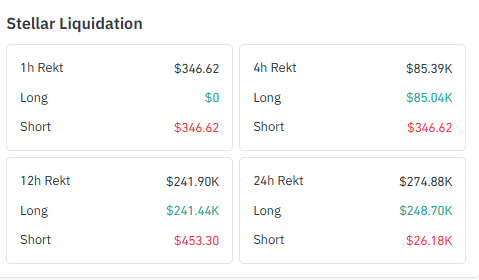
That imbalance shows leveraged buyers absorbed most of the recent pressure.
It does not automatically point to further downside, but it makes the reaction around support and any return of stronger volume important for the next Stellar Price Prediction setup.
Stellar Price Prediction: What Could Confirm the Next Move?
XLM is sitting between a tightening four-hour pattern and a broader daily structure that has already challenged its previous downtrend.
A confirmed four-hour breakout above $0.19345 would strengthen the recovery case, while a loss of the $0.18207 to $0.17785 support area would weaken the current base.
The cleaner signal should come from price confirmation backed by stronger participation.
Until then, both directions remain open, with the chart offering clear levels rather than a confirmed outcome.
What Is the Expert View on the Current XLM Setup?
CoinGabbr Analysts would likely notice a gap between Stellar's strengthening fundamentals and how XLM is actually trading.
The network keeps picking up fresh tokenization activity and pushing further into digital payments, yet derivatives data tells a different story, traders are still active, but recent liquidations have hit long positions hard.
Right now, the fundamental picture looks a lot healthier than the token's actual price performance.
For sentiment to genuinely shift, it's going to take real confirmation through price action and participation, not just another round of ecosystem announcements.
Disclaimer: This article is for informational and educational purposes only and should not be considered financial or investment advice. Cryptocurrency markets are highly volatile, and prices can change rapidly. Always conduct your own research and consult a qualified financial professional before making investment decisions.