Will buyers defend the $0.1495 support zone before November runs out? The Stellar Price Prediction November 2026 starts from a weak spot, with XLM down 27.46% over 30 days. For wider context,
Will buyers defend the $0.1495 support zone before November runs out?
The Stellar Price Prediction November 2026 starts from a weak spot, with XLM down 27.46% over 30 days. For wider context, see thelatest crypto market news.
XLM Price Forecast Market Snapshot
CoinGecko market data ranks Stellar 20th by market cap as of 06:56 UTC.
Metric
Value
Price
$0.1544
24-hour Change
7.80%
Market cap
$5.45B
FDV
$7.708B
24h trading volume
$201.305M
Perps open interest
$282.502M
Source: CoinGecko market data, Nov 6, 2026, 06:56 UTC
Stellar News: Franklin Templeton RWA Growth
RWA means real-world assets, such as fund shares, issued as tokens on a blockchain. Per theRWA Foundation X post, Franklin Templeton holds over $1B in RWA value on Stellar.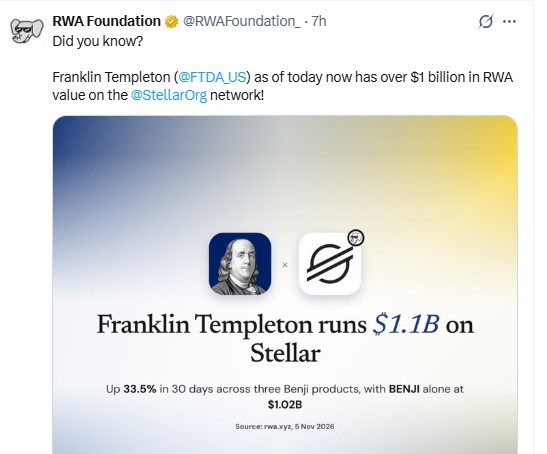
Source: RWA Foundation X post, captured Nov 6, 2026, 06:56 UTC
The post cites rwa.xyz data from Nov 5, 2026, showing $1.1B, up 33.5% over 30 days across three Benji products. Per therwa.xyz Stellar network at 06:56 UTC, distributed asset value, which counts tokenized assets movable on-chain, is $4.49B.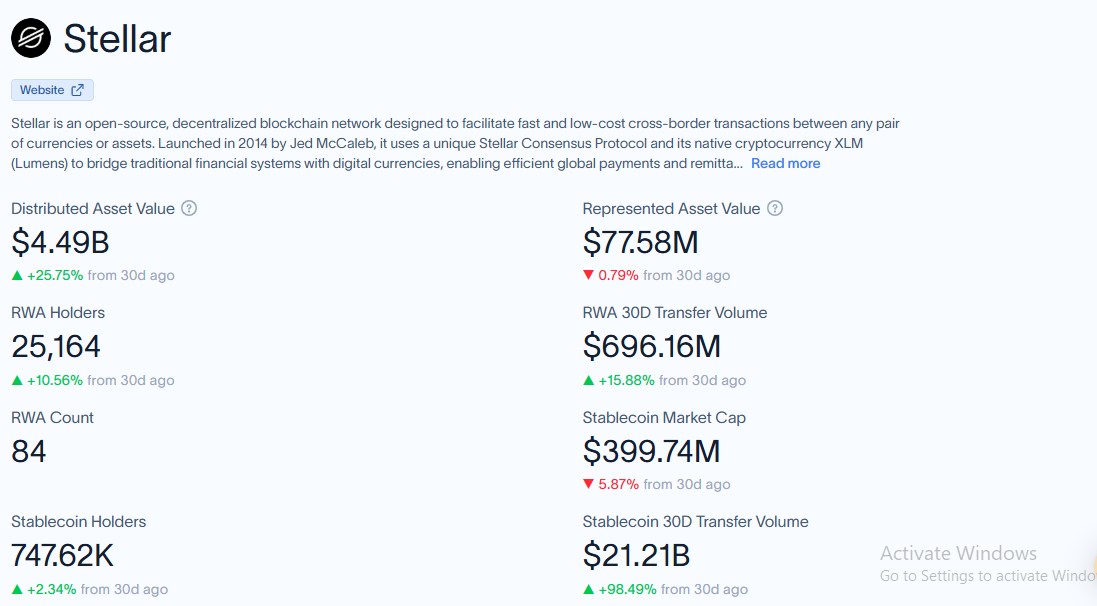
Source: rwa.xyz Stellar network page, captured Nov 6, 2026, 06:56 UTC
So why did $XLM fall 27.46% over 30 days while tokenized value rose 33.5%? If the rwa.xyz figure keeps climbing, the usage story holds, and updates likeStellar news today would reflect it.
CoinGecko performance data at 06:56 UTC shows $XLM down 7.80% over 24h.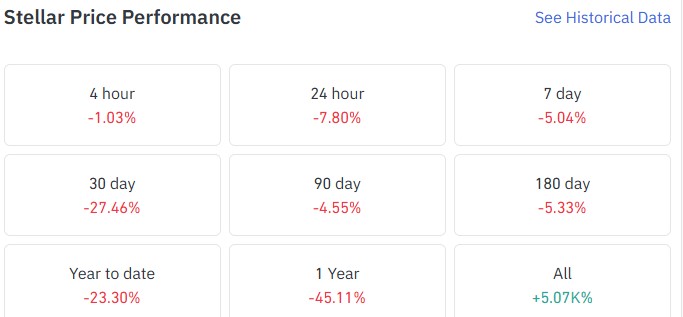
Source: CoinGecko price performance,$XLM, captured Nov 6, 2026, 06:56 UTC
The 24-hour range runs from $0.1517 to $0.1681. Price trades 1.78% above support and 8.15% below resistance.
$XLM is down 23.30% year to date. Most of the damage came inside 30 days, since the 90-day loss is only 4.55%.
XLM Liquidation Data: Longs Take the Hit
Longs got flushed. Liquidation, a forced exit of a margin trade after losses eat the collateral, hit $1.10M over 24h perCoinGlass liquidation data at 06:56 UTC.
Longs lost $1.08M of it. Shorts lost $24.04K. Over the last 12h, longs took the losses again, with $50.18K against $4.45K for shorts.
The last hour brought $780.20, all from shorts.
XLM Open Interest and Futures Volume
Open interest is the total value of futures contracts still open and unsettled. CoinGecko market data at 06:56 UTC puts $XLM perps open interest at $282.502M.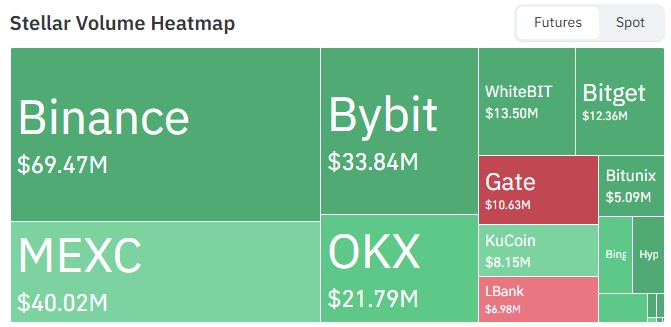
Source: CoinGlass futures volume heatmap, $XLM, captured Nov 6, 2026, 06:56 UTC
Per the CoinGlass volume heatmap at 06:56 UTC, Binance shows $69.47M in $XLM futures volume, and MEXC shows $40.02M.
But Bybit shows $33.84M, and OKX shows $21.79M.
XLM Technical Analysis: 50-Day EMA and RSI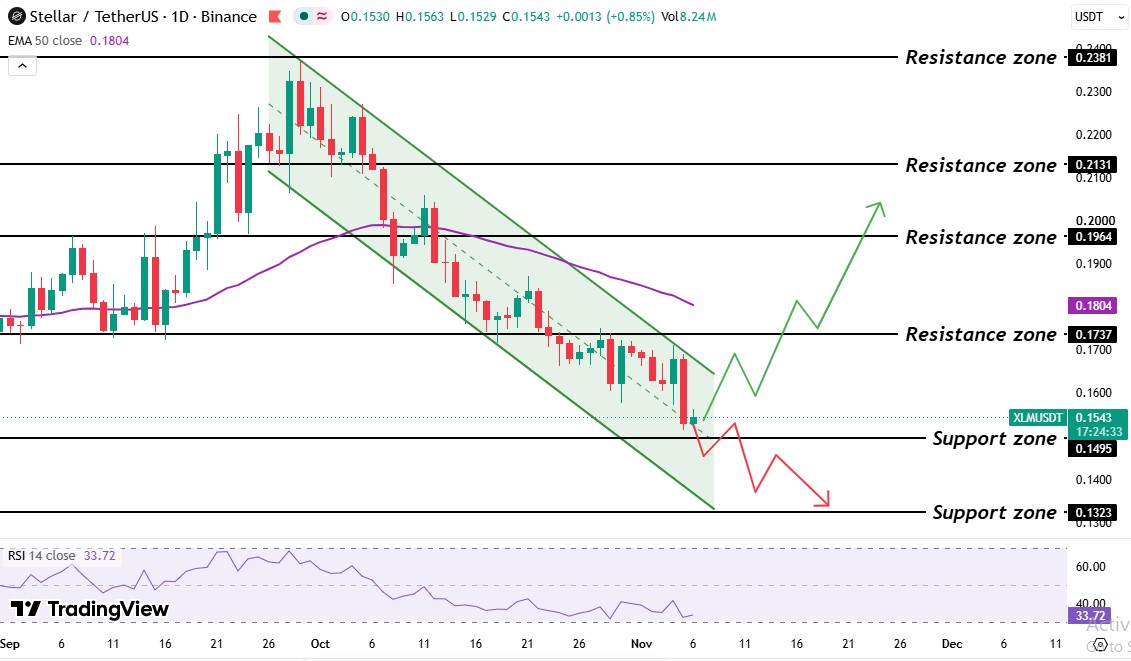
Source: TradingView, XLM/USDT 1D, EMA 50, and RSI 14, Nov 6, 2026, 06:56 UTC
The Binance 1D chart for $XLM/USDT on TradingView, captured Nov 6, 2026, 06:56 UTC, frames this Stellar Price Prediction November 2026. A sharp September rally spiked to the $0.2381 level before sellers took control.
After the rally covered in theStellar channel breakout forecast, $XLM slid inside a descending channel with two falling parallel trendlines. Sellers defended the upper trendline many times, and the price now trades just above the $0.1495 support zone, where buyers have stepped in.
The $XLM 50-day EMA sits at $0.1804. $XLM trades 14.41% below it. The $XLM RSI reads 33.72, so sellers hold the edge and oversold conditions haven't formed.
Stellar Support Levels and Resistance Levels
Level
Type
$0.2381
Resistance zone
$0.2131
Resistance zone
$0.1964
Resistance zone
$0.1804
50-day EMA
$0.1737
Resistance zone
$0.1495
Support zone
$0.1323
Support zone
Support levels and resistance levels mark where buyers and sellers have acted before. The nearest pair is $0.1495 below and $0.1737 above.
Steller Price Prediction: Bull, Base, and Bear Scenarios
Scenario
Trigger
Target
Invalidation
Bull
Daily candle above $0.1737
$0.1964 than $0.2131
Daily candle back below $0.1737
Base
Holds $0.1495, stalls below $0.1737
Range
Daily candle outside the range
Bear
Daily candle below $0.1495
$0.1323
Daily candle back above $0.1495
Regulatory delay is one risk, since slower rules would slow the RWA story. Technical invalidation is the other.
Stellar Price Prediction November 2026: Expert view
As per CoinGabbar analysis, the Stellar Price Prediction November 2026 carries a neutral base with a downside tilt. $XLM trades 14.41% below the 50-day EMA, and the 30-day drop is 27.46%. The RSI reads 33.72. Those numbers favor sellers.
Against that, the $0.1495 support sits only 3.17% below price.
A daily candle trading under $0.1495 means sellers have won the range, and $0.1323 becomes the target.
YMYL Disclaimer: This article is for educational and informational purposes only. It does not offer financial advice, price guarantees, or return promises. Crypto assets are volatile