Silver has pulled back after a powerful rally, though one long term chart suggests this decline may be testing one of the most important price levels in decades. That chart has followed silve
Silver has pulled back after a powerful rally, though one long term chart suggests this decline may be testing one of the most important price levels in decades. That chart has followed silver through multiple bull and bear markets across nearly 50 years. Every major rejection and breakout has happened around the same trendline. Now, silver price has returned to that same area once again.
That is exactly what commodity analyst Graddhy pointed out in a recent market update. The chart shows a trendline that acted as resistance for decades before silver finally broke above it. Current price action has brought silver back to that line. That makes this one of the most closely watched technical levels on the chart.
Silver Price Is Testing a Trendline That Has Defined Nearly 50 Years of Market History
A look at the monthly silver chart reveals why this trendline matters so much. The blue line stretches back almost 50 years. Silver first met that level during the historic rally around 1980. Several decades later, the same line stopped another major advance near the 2011 peak. Those repeated failures turned the trendline into one of the strongest long term resistance levels on the chart.
Everything changed after silver finally broke above that barrier during the recent rally.
Graddhy noted that silver is now returning to one of the possible backtest support levels. That changes the role of the trendline completely. Resistance often becomes support after a successful breakout. Technical analysts frequently watch for this type of retest because it helps determine whether a breakout is genuine.
That possibility gives this chart extra importance. Silver is no longer trying to overcome the line. Silver price is now testing whether that former ceiling can become a new floor.
This Historic Silver Level Could Decide the Next Long Term Direction
This support test may carry important implications for the long term silver outlook.
A successful defense of the trendline could indicate that silver may struggle to break below the $50 region. That area may develop into a strong foundation for future advances if buyers continue defending it over time.
History offers another interesting possibility. Even if silver eventually falls below this trendline, the level may still continue influencing price for years. Former support levels often become resistance after a breakdown. Markets frequently revisit these areas several times before establishing a completely new trend.
That possibility does not automatically point to weakness. Long term technical levels often remain relevant across multiple market cycles. Silver has respected this particular trendline for decades. Current price action suggests the market still recognizes its importance.
Silver Price Outlook Shows Two Key Support Zones to Watch
Silver price currently trades around $56 after retreating from recent highs.
Current technical levels show the next weekly support zone between $52 and $48. Buyers may attempt to defend that area if the current pullback continues.
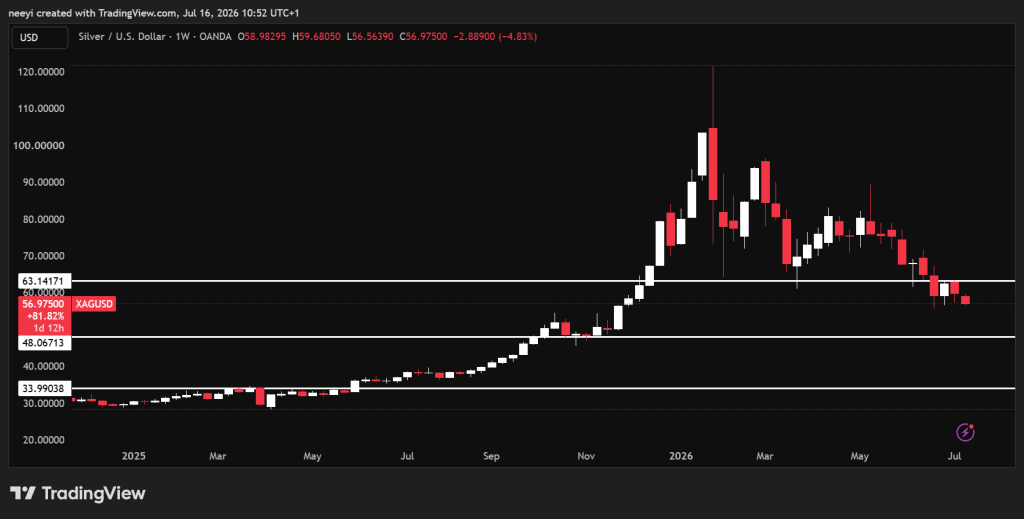
XAUUSD Chart / TradingView.com
A successful hold above this range could allow silver price to recover toward $63. That move would place the recent correction behind the market and could reopen the path toward another advance.
Another scenario deserves attention.
Failure to hold the $48 support zone would weaken the current technical picture. Silver could eventually decline toward the upper $30 region between $36 and $39 if selling pressure continues beyond that level.
Read Also: This Analyst Has A Viral Silver Price Prediction
That outlook does not necessarily change the broader long term picture. Much depends on whether the historic trendline continues acting as support over the coming months.
Silver has already spent decades respecting this single line during both rallies and corrections. Current price action now places the market back at that familiar crossroads. The next response around this historic level could offer valuable clues about where silver price heads over the months ahead.
FAQs
Why is silver called XAG?Why is Silver called XAG? XAG is the ISO 4217 currency code for one troy ounce of silver. The “X” prefix marks it as a supranational currency (not issued by any single country), and “AG” comes from argentum, Latin for silver. Same system that gives gold XAU and platinum XPT
How high will silver go in 2026?Wall Street forecasts silver will likely trade between $70 and $90 per ounce for the remainder of 2026, with major institutions predicting a full-year average of about $81/oz. Bullish analysts see potential peaks ranging from $100 to over $165/oz if physical market shortages intensify.
Subscribe to our YouTube channel for daily crypto updates, market insights, and expert analysis.
The post The One Silver Chart That Predicted Every Major Move for 50 Years appeared first on CaptainAltcoin.