Silver price is right now around $60 after a pretty boring week of price action. The metal has been consolidating after the sharp decline from the January highs above $117. Volatility has sub
Silver price is right now around $60 after a pretty boring week of price action. The metal has been consolidating after the sharp decline from the January highs above $117. Volatility has subsided. Traders are waiting for direction.
But one analyst, Sqeaky Mouse, shared an interesting chart on X that caught my attention. His silver price prediction is getting viral for a reason. Let us analyze it.
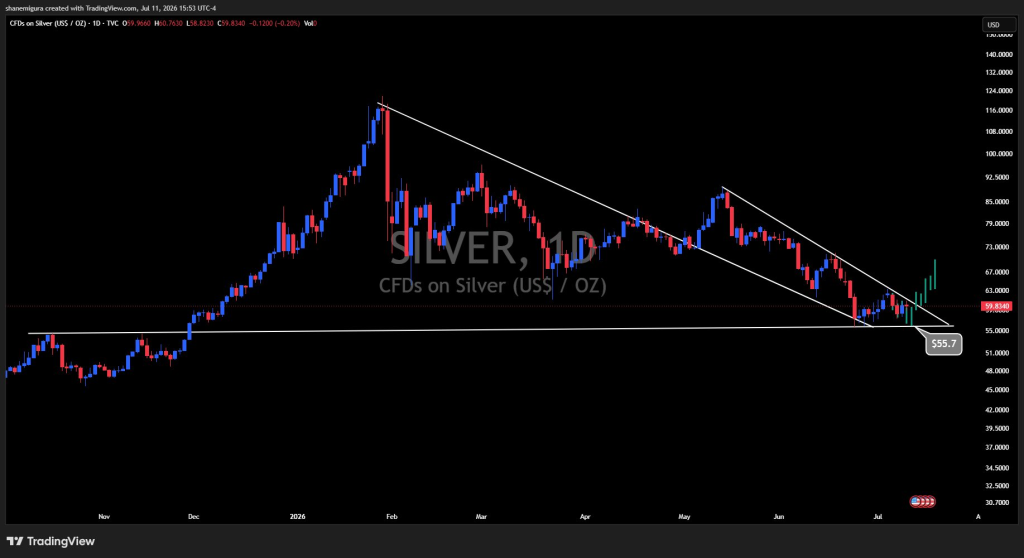
Sqeaky Mouse tweeted: “Silver is still on track meaning if the rest plays out will put a bottom in on Monday or Tuesday around a price of $55.7-$56.”
His thesis is clear. The current decline is not finished. Price should complete one more downward leg. The decline should terminate near $55.7-$56, producing a major bottom. After that bottom, the expectation is for a bullish reversal.
The projection is not random. It comes from technical confluence. The author expects price to test horizontal support, touch the lower channel, complete the final selling wave, and then see buyers step in for a trend reversal.
Silver Chart Analysis: Three Phases and a Falling Wedge
The chart shows three major phases. The first phase was a strong bull market from approximately $48 to $117. Silver nearly doubled with higher highs, higher lows, expanding momentum, and strong buying pressure. This was a classic impulsive bullish trend.
The second phase was distribution. After peaking around $117, the silver price failed to continue higher. Instead, we saw a violent selloff, lower highs, and increasing volatility. This indicates institutions began distributing positions after the major rally.
The third phase is the current downtrend. From February onward, we have seen lower highs and lower lows. This is the definition of a downtrend. The white trendline drawn from the February high captures this perfectly.
 Source: X/@TheSqeakyMouse
Several overlapping patterns are visible. The longest white line connects the February peak, April highs, and July highs. Each rally stops at this trendline, telling us sellers consistently defend it. This trendline represents the dominant trend. Until broken, the market remains technically bearish.
The recent decline forms a descending channel with lower highs, lower lows, controlled decline, and decreasing momentum. Descending channels often end with upside breakouts, but they frequently make one final touch of channel support first. That is exactly what the tweet expects.
The most recent candles are beginning to compress. The upper trendline slopes downward while the lower support is relatively flat near $55.7. This begins to resemble a falling wedge, which is typically a bullish reversal pattern.
Why $55.7-$56? The Confluence
The $55.7-$56 level is not random. It is where multiple technical tools agree.
Previous horizontal support exists here. Price previously reacted at this level. The lower channel trendline intersects near this price. The $56 round number attracts liquidity. This creates confluence, which is the strongest type of support.
Secondary support sits around $57-$58, but this is weak support. If selling accelerates, price likely moves toward $56.
On the resistance side, the first resistance is around $60-$61, where current price struggles. Second resistance is around $63-$64, previous swing highs that would likely produce profit-taking. The most important resistance is the trendline, currently intersecting near $61-$62. Every rally has failed here. Until broken, the trend remains bearish.
The recent candles show smaller bodies, reduced downside momentum, and some bullish candles appearing. This indicates selling pressure is slowing, although buyers have not yet gained control. A bullish reversal candle near $56 would strengthen the case.
Read also: Gold and Silver Price Forecast: Popular Analyst Says Buy the Panic at $3,600 and $50
Silver Price Predictions
Bullish Scenario
If silver reaches $55.7-$56 and holds support, forms bullish reversal candles, and breaks the descending trendline, then the next likely targets become $60, $63, $68, and $73. Above $73, the larger trend would become considerably more bullish. A daily close above the descending trendline would be the first confirmation that the downtrend is over.
Neutral Scenario
Price reaches $56 and moves sideways. This would create a base before deciding direction. This is common after steep declines and would mean the market is building a foundation for the next move.
Bearish Scenario
If $55.7 fails decisively, the chart changes significantly. Next downside levels could be approximately $53, $51, and $48. A confirmed daily close below $55.7 would invalidate the expected bottom and indicate the broader downtrend is extending.
My Take on This Silver Price Analysis
Overall, Sqeaky Mouse’s silver price prediction is technically sound. The confluence at $55.7-$56 is real. The descending channel, the horizontal support, and the falling wedge all point to the same area. If silver reaches that level and holds, the risk-reward for a long position is attractive.
But the trend remains bearish until the descending trendline is broken. A bounce from $56 could be just a relief rally if it fails to break the trendline. The confirmation is the breakout, not the support test.
For traders, the $55.7-$56 area is worth watching. But wait for a bullish reversal candle and a break above the trendline before committing to a long position.
Subscribe to our YouTube channel for daily crypto updates, market insights, and expert analysis.
The post This Analyst Has A Viral Silver Price Prediction appeared first on CaptainAltcoin.