BlockDAG Price Drops to $0.0000152 After a One-Day Slide BDAG traded near $0.00001520 on November 5, 2026, down 19.51% in 24 hours. The BlockDAG price slid one day after the project’s Novembe
BlockDAG Price Drops to $0.0000152 After a One-Day Slide
BDAG traded near $0.00001520 on November 5, 2026, down 19.51% in 24 hours. The BlockDAG price slid one day after the project’s November 4 post on exchange plans.
This outlook reads the one-day candle, tests rebound math, and sets three paths to month-end.
What the November 4 Post Says About Launch Plans
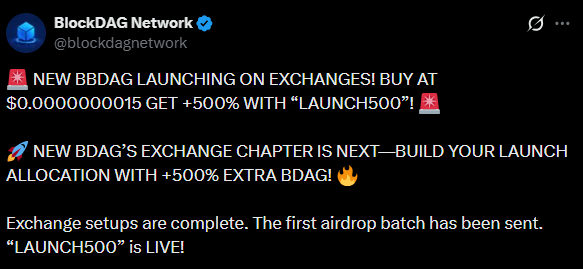
According to the project, its X post of November 4, 2026, says exchange setups are complete. It names no exchange and gives no trading date. A BlockDAG listing therefore remains unconfirmed.
Item
Status in the post
Exchange setups
Described as complete
First airdrop batch
Described as sent
Targets
$0.65 for NEW BDAG, $1.00 for BDAGUSD
Venue name
Not given
Trading date
Not given
The website timer reads 1 day, 12 hours, and 45 minutes, with 62.23M presale coins left.
Source: Official X Post
Reading a Candle That Opened High and Sits at Its Low
Levels in this section are read by eye from the chart, so they are approximate.
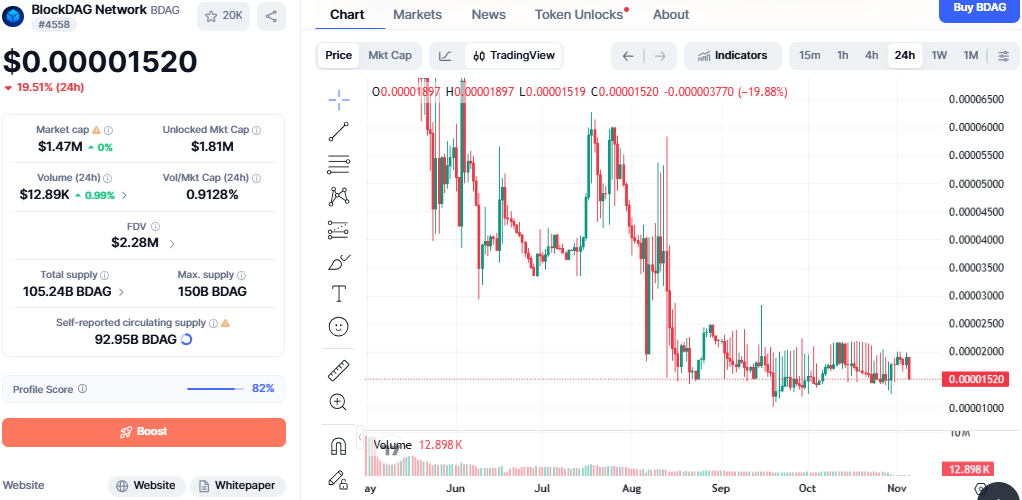
The daily candle opened at $0.00001897 and fell to $0.00001519. It now sits at $0.00001520, almost exactly at the low, a loss of 19.88%.
The 24-hour loss of 19.51% came with volume of only $12.89K, up 0.99%. A fall that size on thin trading suggests few orders set the BlockDAG price.
Tracker data shows market cap at $1.47M and fully diluted valuation (FDV) at $2.28M. Volume equals 0.9128% of market cap.
On the chart, the token has traded between about $0.0000105 and $0.0000245 since late August. The latest low sits in the lower half of that range. Seen from the July peak near $0.0000600, the latest quote is about 75% lower.
Source: CoinMarketCap Chart
Note: Prices can change quickly, so figures may not reflect the latest value. Readers should check a live price tracker for current data.
Rebound Math: What It Takes to Retake $0.0000190
A 19.88% fall needs a rise of about 25% to return to the $0.00001897 open. That gap is the first test for the BlockDAG price.
Each step below is measured from $0.00001520. Percent moves are not symmetric, since a 20% fall needs a 25% gain to recover.
Step
Level
Move
Reference
Half recovery
$0.0000171
+12.5%
Half the drop regained
Full recovery
$0.0000190
+25%
Back to the open
Range test
$0.0000220
+45%
Mid October highs
Further, 10% fall
$0.0000137
-10%
Below the latest low
Further, 20% fall
$0.0000122
-20%
Near the late October low
September low
$0.0000105
-31%
Lowest area since August
BlockDAG Price Prediction Paths to November 30, 2026
Each path starts from $0.00001520 and treats the BlockDAG listing as unconfirmed.
Path
Trigger
Zone
Move from $0.00001520
Bull
Close above $0.0000190 and a venue named
$0.0000190 to $0.0000220
+25% to +45%
Base
Closes hold above $0.0000122 and below $0.0000190
$0.0000122 to $0.0000171
-20% to +12.5%
Bear
Close below $0.0000137 with no venue news
$0.0000105 to $0.0000122
-31% to -20%
The base path fits best, since the token spent about two months inside a wide range. A bounce to $0.0000171 would recover half of the one-day drop. Quotes between $0.0000137 and $0.0000171 would fit this case.
The bull path needs a close above $0.0000190, which would erase the full drop. A named exchange with a trading date could lift the BlockDAG price toward the upper range. The first hurdle sits near $0.0000190, the open of the latest candle.
The bear path starts with a close below $0.0000137. Without venue news, thin volume could let the fall extend toward the $0.0000105 September low.
Four signals would shift these paths:
A named exchange with a dated trading start.
Volume rising well above $12.89K.
A close above $0.0000190 or below $0.0000137.
Any change to the presale timer or remaining coins.
Dated checkpoints help test each scenario:
November 12, 2026: a close above $0.0000137 keeps the base case alive.
November 19, 2026: a close above $0.0000171 shows half the drop recovered.
November 26, 2026: a close above $0.0000190 would favor the bull case.
This outlook covers the period through month end and needs weekly review.
Expert Opinion on Volume and Exchange Risk
A one-day fall of 19.51% on $12.89K of volume shows how sensitive this market is to single orders. Rebound math is a reference, not a forecast. Thin markets can also reverse fast, so single-day candles need follow-through.
A confirmed exchange would give analysts firmer inputs than timers do. Until then, the BlockDAG price depends on chart levels and thin trading.
What to Track After the November 5 Drop
The quote sits in the lower half of a two-month range, with no named venue. Any BlockDAG price recovery now depends on dated project updates. A close under $0.0000137 would shift focus to the September low.
Readers can follow the project’sofficial X account for dated updates. Any new post will test this outlook.
YMYL Disclaimer: This article is for educational and informational purposes only. It does not offer financial advice, price guarantees, or return promises. Crypto assets are volatile, so readers should research independently before making decisions.
