Analyst identifies $1.55 as a key breakout level, with potential targets at $3.20 and $10 if XRP clears the resistance. Egrag’s three historical XRP expansions averaged 1,552% arithmetically
- Analyst identifies $1.55 as a key breakout level, with potential targets at $3.20 and $10 if XRP clears the resistance.
- Egrag’s three historical XRP expansions averaged 1,552% arithmetically and 1,444% geometrically, informing his cycle analysis.
- XRP remains above its 50-day and 200-day moving averages, with $1.39-$1.40 as immediate support and $1.435 as resistance.
XRP is trading near $1.404 after an August surge, while analysts Crypto Patel and Egrag Crypto outlined separate price scenarios. Patel identified $1.55 as a breakout level toward $3.20 and $10, while Egrag measured prior macro expansions and reviewed current chart levels after XRP recovered from its August low on the chart.
Crypto Patel Maps $1.55 Breakout
Crypto Patel said XRP remains above its key accumulation zone as the higher-timeframe structure strengthens. According to the analyst, a move above $1.55 could open targets at $3.20 and $10. Those levels follow XRP’s August recovery from $1.00 to $1.58.
The setup depends on XRP clearing the $1.55 level. Meanwhile, Egrag Crypto examined XRP’s previous macro expansions using three historical price advances. The first cycle gained 2,405%, while the second increased 1,002%.
Egrag Calculates XRP’s Historical Expansions
Egrag’s third cited macro expansion produced a 1,250% increase. Together, those figures give an arithmetic average of about 1,552%. However, Egrag also calculated a geometric mean of about 1,444%.
https://twitter.com/egragcrypto/status/2096125783747989752?s=20
He described the geometric mean as a measure of average compounded expansion across the three cycles. Those figures form the basis for Egrag’s macro-cycle calculation. His analysis then turns to XRP’s recent price structure and the levels visible on the chart.
XRP Holds Above Key Moving Averages
From March through mid-May, XRP traded mostly between $1.30 and $1.50. The decline accelerated in late May and June, taking XRP below $1.13. XRP later reached about $0.99 to $1.00 around Aug. 19.
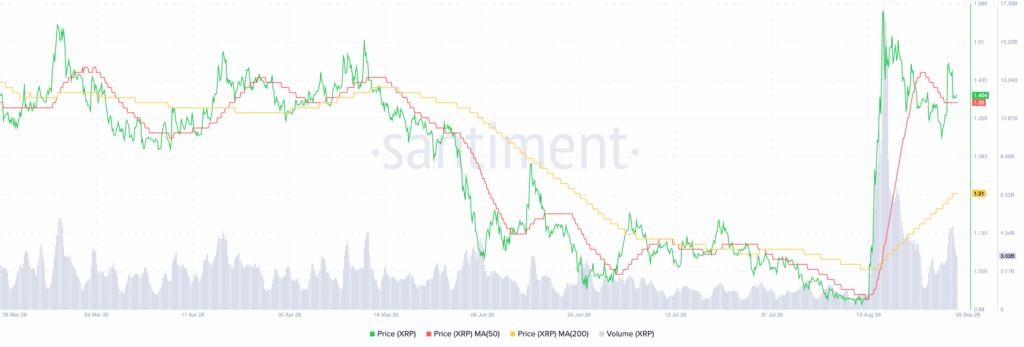
Source: Santiment
Then, an August breakout lifted the price to roughly $1.58 and came with a sharp volume increase. After that rally, XRP corrected and stabilized around $1.404. The 50-day moving average sits near $1.39, while the 200-day average is around $1.21.
Notably, XRP remains above both averages, and the 50-day average has turned upward. Immediate support is at $1.39 to $1.40, followed by $1.35 and $1.21. On the upside, $1.435 marks resistance, while $1.50 and $1.58 remain stronger levels. A break below $1.39 would expose the lower support areas.