Key Takeaways The pullback has reached deeper supports. $1.42 combines Fibonacci and diagonal support. $1.35 could become the broader test. RSI has cooled from earlier highs. The September st
Key Takeaways
- The pullback has reached deeper supports.
- $1.42 combines Fibonacci and diagonal support.
- $1.35 could become the broader test.
- RSI has cooled from earlier highs.
- The September structure remains constructive for now.
XRP has moved beyond its first pullback test
At the time of writing, XRP traded near $1.48, according to CoinMarketCap data, after slipping below the 23.6% Fibonacci retracement near $1.53. That level had offered the first potential cushion following XRP’s recovery toward the recent $1.70 high. Trading beneath it is shifting attention toward the deeper support areas below.
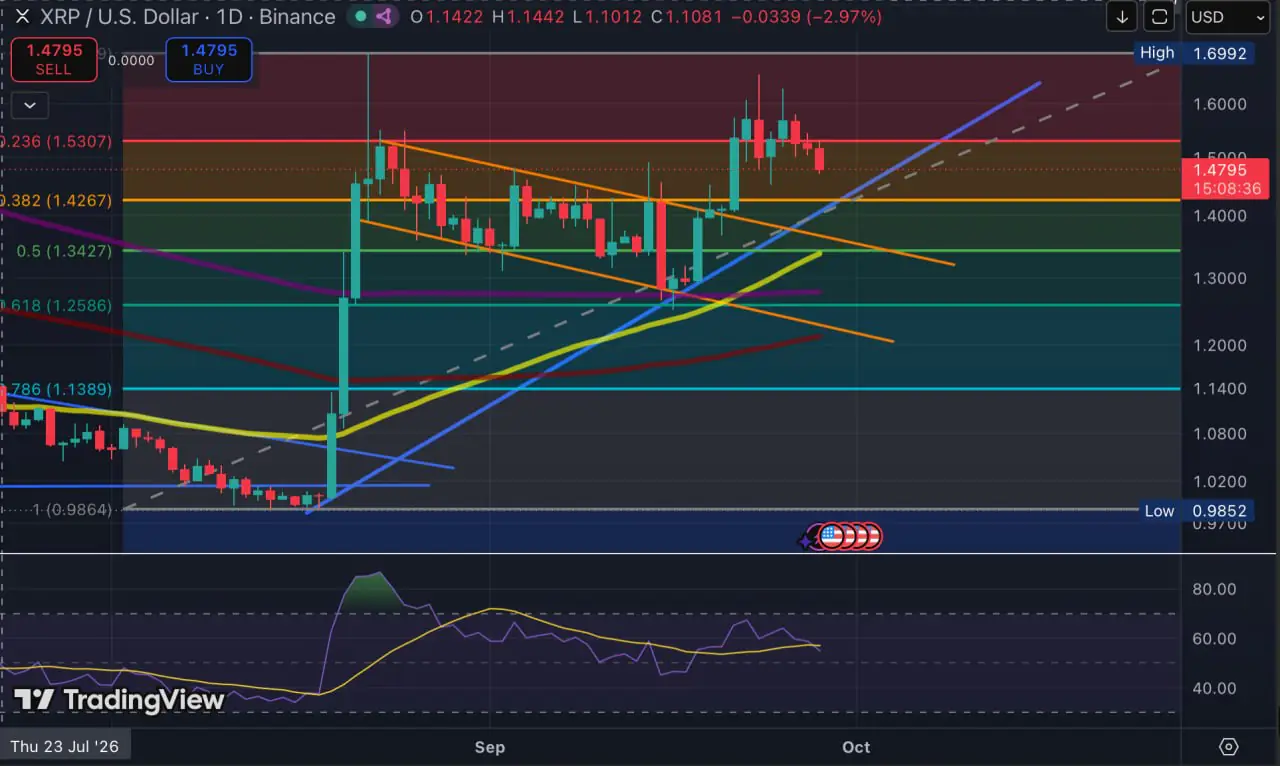
XRP/USD daily chart / Source: TradingView.
The Fibonacci levels are drawn from the visible daily advance between the late-August low near $0.99 and the recent high around $1.70. They offer reference areas for a pullback; they do not predict where price must reverse.
Attention now shifts to the lower chart areas where Fibonacci levels overlap with XRP’s existing structure.
Coindoo recently examined whether XRP’s recovery could develop into a sustained trend. That earlier analysis focused on the breakout attempt and market activity around it. The current chart tracks the pullback that followed.
The first deeper test sits around $1.42
The 38.2% Fibonacci retracement lies near $1.42-$1.43. The rising diagonal support line also approaches this area, giving the range more significance than either reference would have on its own.
Chart confluence does not create an exact price that must hold to the cent. XRP could briefly move through the range and recover, or it could remain below it for several daily sessions. Those outcomes would suggest different levels of demand during the pullback.
Near $1.53 · First pullback level lostThe shallow retracement failed, sending attention to the lower support zones.
Around $1.42 · First decision zoneThe 38.2% retracement and rising diagonal support reach the same area.
Around $1.35 · Deeper structural testThe 50% retracement and the former flag ceiling could become the market’s next references if $1.42 gives way.
The $1.35 area could test the earlier breakout structure
If XRP trades decisively below $1.42, attention could move toward the $1.34-$1.36 zone, where the 50% Fibonacci retracement sits near $1.34.
The upper boundary of the earlier flag pattern, which XRP broke above during the September recovery, also reaches this range. If price enters it, traders may watch whether buyers respond around the former flag ceiling after the earlier breakout. Its overlap with the 50% Fibonacci level gives the area added weight.
The 50-period SMA is nearby as well. It may reinforce the wider zone, though the average can continue rising but the 50% Fibonacci retracement provides the more stable reference for readers watching the chart over several sessions.
The earlier $1.60 barrier provides context
Our team previously covered XRP’s encounter with a familiar resistance area near $1.60. XRP later moved above that range and reached a local high near $1.70.
The present pullback may show whether the levels recovered during that advance can begin to provide support on the way down. That makes the lower chart areas more immediate references than distant upside projections.
READ MORE:
 Arbitrum Price Analysis: Will the September Support Hold?
Cooling momentum still leaves room for a correction
Daily RSI has fallen from its earlier high and is no longer in overbought territory. The move suggests that the rapid momentum behind XRP’s recovery has eased.
RSI is best used here as context rather than a timing signal. Price behaviour at $1.42 and, if necessary, $1.35 could provide a clearer test of whether buyers remain active during the correction.
XRP remains well above the late-August base near $1.00, while the daily chart still carries a rising support line beneath price. Those features leave the September recovery structurally intact for now.
How XRP behaves at $1.42 may define the pullback
XRP has moved past the first shallow pullback level, leaving the $1.42 area as the next test of the September recovery. A recovery that holds around that range could keep the decline within a broader correction.
Continued trading below that zone could shift attention toward $1.35, where the 50% retracement and the former flag boundary meet. How XRP trades through those two support areas may offer a clearer reading of the rally’s durability than another distant target.
This article is provided for informational purposes only and does not constitute financial or investment advice. Cryptocurrency prices are volatile, and technical levels can change quickly.
The post XRP Price Gives Up First Support – Why $1.42 is Back in Focus appeared first on Coindoo.