The altcoin market-cap index recovered from $197-$200B to around $226-$227B after breaking above $210B. Analyst identifies a long-term ascending triangle on TOTAL2 and sees potential for a $5
- The altcoin market-cap index recovered from $197-$200B to around $226-$227B after breaking above $210B.
- Analyst identifies a long-term ascending triangle on TOTAL2 and sees potential for a $5T altcoin market cap.
- RSI remains above 50, but a bearish MACD crossover puts $220B, $210B and $200B support levels in focus.
Altcoins have rebounded in recent days, with the market-cap index excluding the top 10 reaching $226–$227 billion. Analysts El Crypto Prof and Javon Marks highlighted longer-term altcoin setups, while recent chart data shows momentum cooling after the latest advance since September 16.
El Crypto Prof Sees Five-Year Pattern
According to El Crypto Prof, TOTAL2 has formed a bullish ascending triangle for almost five years. He said a $5 trillion altcoin market cap remains possible over time. He also asked whether market participants are ready for the next run.
TOTAL2 tracks the cryptocurrency market capitalization excluding Bitcoin. However, the chart provided here covers cryptocurrencies outside the top 10. Therefore, its figures offer a separate view of that market segment.
Javon Marks Points to Alt Dominance
Analyst Javon Marks pointed to the macro chart of Alt Dominance. According to Marks, its trend structure shows altcoins ready for a large altseason. He described the current period as a potential shift and urged his audience to stay ready.
https://twitter.com/JavonTM1/status/2101340564293591332?s=20
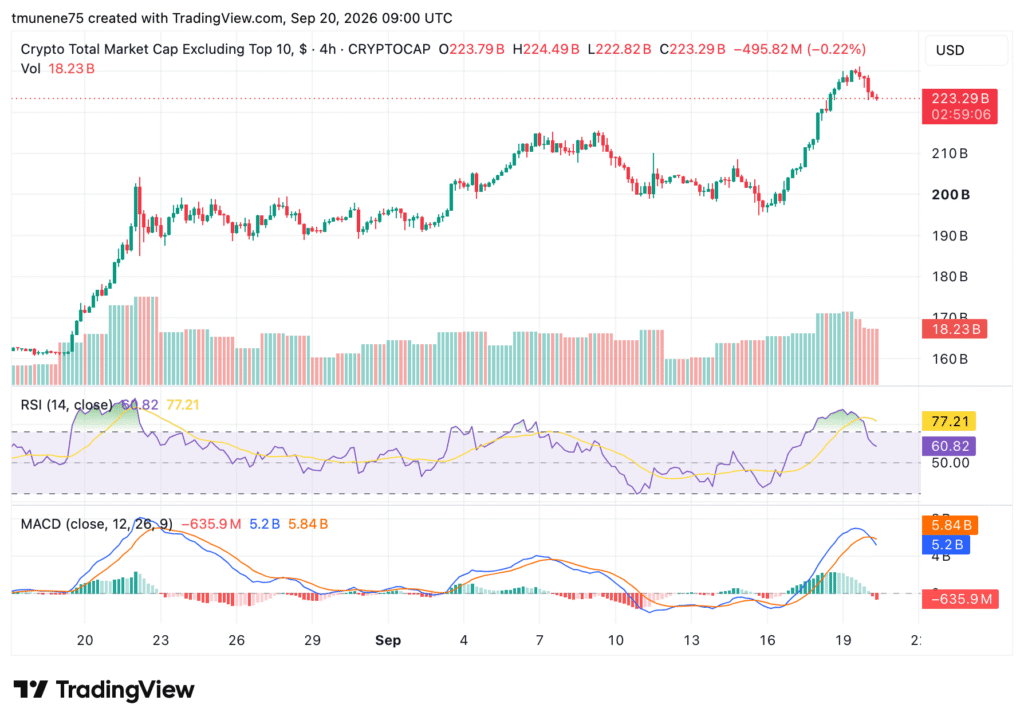
Meanwhile, the broader index has posted a sharp recovery since September 16. The index stood around $197–$200 billion before breaking above $210 billion. It then accelerated toward roughly $226–$227 billion.
RSI Cools as MACD Turns Lower
The index currently is at $223.29 billion, down $495.82 million, or 0.22%, on the latest four-hour candle. The period recorded a $224.49 billion high and $222.82 billion low. Volume is near $18.23 billion, while recent bars have declined during the pullback.
Source:
TradingView
RSI is at 60.82, below its 77.21 moving average. RSI also fell from above 70 but remains above 50. However, the MACD shows weaker short-term momentum. The MACD line is at $5.2 billion, below the $5.84 billion signal line. Its histogram is near negative $635.9 million.
Resistance remains around $226–$227 billion. Initial support sits near $220 billion, followed by $210 billion and $200 billion.