Solana averaged 9.5M new addresses daily, while wallets holding at least 10,000 SOL increased by 1.58%. U.S. spot SOL ETFs recorded seven straight weeks of inflows, attracting over 1.2M SOL l
- Solana averaged 9.5M new addresses daily, while wallets holding at least 10,000 SOL increased by 1.58%.
- U.S. spot SOL ETFs recorded seven straight weeks of inflows, attracting over 1.2M SOL last week.
- $103 remains key support, while breaks above $123 and $132 could open the path toward the $150 target.
Solana has held above $100 despite an 8.31% pullback from $110.50 since August 26, according to analyst Ali Charts. Network activity, whale holdings, U.S. spot SOL ETF inflows, and exchange balances have all shifted during the period, while spot flows remain mixed as SOL trades around $102-$104 on September 1.
Solana Network Activity Keeps Expanding
Ali Charts reported that Solana averaged 9.5 million new addresses daily over the past week. The figure comes as SOL declined from $110.50 to $100.40. At the same time, wallets holding at least 10,000 SOL increased 1.58%.
https://twitter.com/alicharts/status/2094405047845056529?s=20
That added 52 new whale wallets during the period. The network data follows SOL’s move from roughly $86-$88 on August 19. The token climbed above $100 by August 25 before reaching nearly $110 around August 27-28.
That price move also came alongside sharp spot-market inflows. A positive flow reached about $31 million around August 25. Another inflow approached $20 million around August 27.
ETF Inflows Add to Solana Demand
Meanwhile, U.S. spot SOL ETFs recorded seven straight weeks of net inflows. Ali Charts said the products attracted more than 1.2 million SOL last week. The amount represented approximately $120 million based on his figures.
Exchange balances also moved lower during the same period. SOL held on exchanges declined 4.91%, with about 2.6 million SOL withdrawn over one week. However, spot flows remained uneven as SOL approached its recent high.
Several outflows appeared around August 28, including readings near $10 million to $14 million. Another outflow reached roughly $15 million around August 31.
$103 Support Becomes the Main Price Test
Ali Charts identified $103 as a major support zone, where about 39 million SOL were previously acquired. He placed resistance near $123 and $132. Roughly 20 million SOL were acquired around each resistance area, according to his analysis.
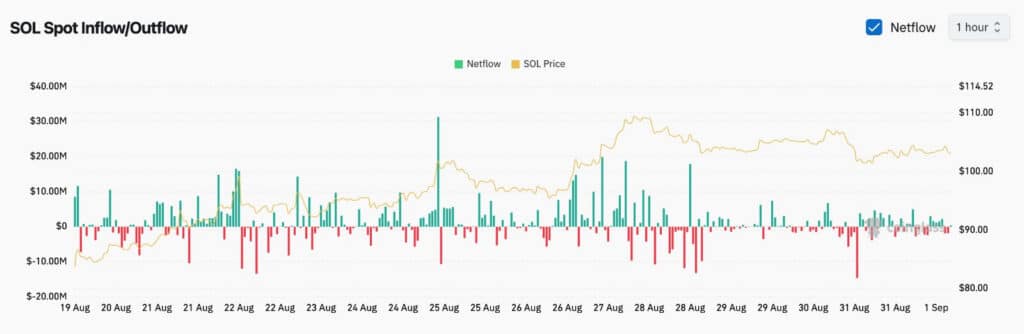
Source: Coinglass
A break above both levels would put his $150 target in focus. The latest spot data shows SOL around $102-$104, below its roughly $110 peak. The chart also shows reduced flow strength compared with earlier sessions.
As a result, $100 remains another area visible in the recent price structure. Persistent outflows could expose that level, while renewed inflows could support a move toward $105-$110.