$BCH is trading around $212.7 right now, sitting close to a key support zone as weak selling pressure continues to come down from a descending trendline overhead. The bigger Bitcoin Cash pric
$BCH is trading around $212.7 right now, sitting close to a key support zone as weak selling pressure continues to come down from a descending trendline overhead.
The bigger Bitcoin Cash price prediction question today is whether buyers can hold this zone and flip the trendline, a setup that builds on what we flagged in our earlier piece onBCH support breaks.
$BCH Today's Market Snapshot
Metric
Value
Price
$212.7
24h Change
-2.36%
Market Cap
$4.26B
Futures Volume (24h)
$463.91M
Spot Volume (24h)
$19.32M
Open Interest
$368.95M
Circulating Supply
20.06M BCH
Total Supply
20.06M BCH
Max Supply
21.00M BCH
Bitcoin Cash Liquidation Data
BCH liquidation data fromBCH market data shows shorts absorbing most of the pressure over the shorter timeframes, while longs have taken the bigger hit over the last day.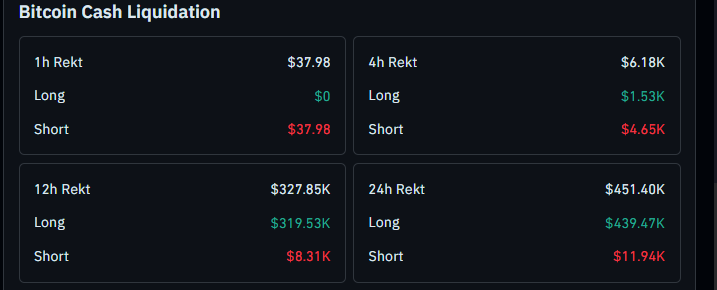
Over the past hour, $37.98 in total liquidations occurred, entirely from shorts, with no long liquidations recorded.
The 4-hour window shows $6.18K in liquidations, with $1.53K from longs and $4.65K from shorts.
Over 12 hours, liquidations climb sharply to $327.85K, with $319.53K coming from longs against just $8.31K in shorts.
Across the full 24 hours, total liquidations reach $451.40K, with longs accounting for $439.47K and shorts just $11.94K, according toBCH liquidation data.
This shows a large number of leveraged longs got caught out as $BCH slid into the current support zone.
Bitcoin Cash Technical Outlook
$BCH is currently trading near its support zone, and weak selling pressure has been coming down off a descending trendline that has capped every bounce attempt so far.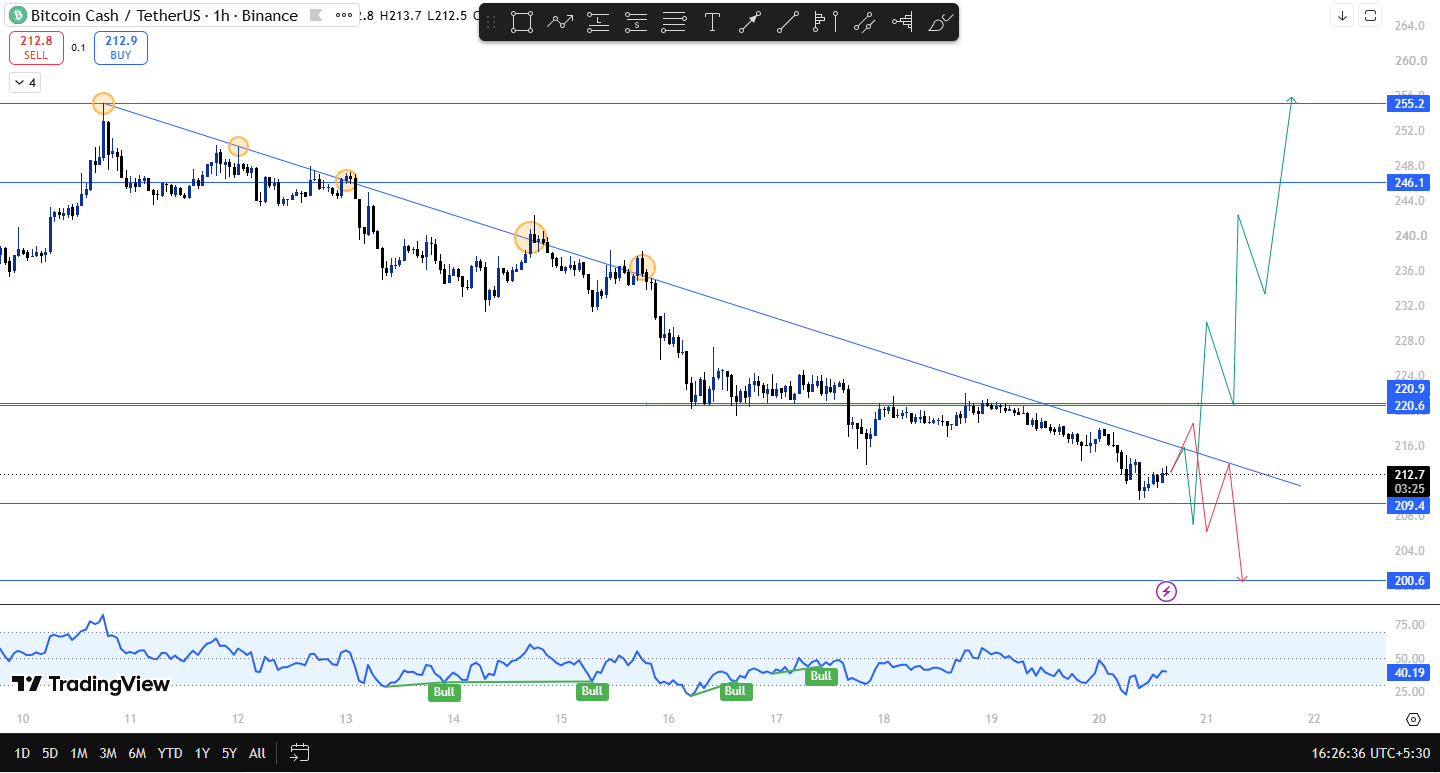
You can follow thelive BCH price as this battle continues to play out.
If the market takes support from $209.40, that would need to come along with a break of the recent swing high and price sustaining itself near the trendline.
From there, if BCH manages to break out above the flip zone, it opens the door toward $246.1 and then $255.2, which stand out as the key resistance levels on the way up.
If price instead fails to close above the trendline, the next support to watch is $209.40, and if that gives way, $200.60 is the level after that.
$BCH Support and Resistance Levels
Type
Level
Note
Resistance 2
$255.2
Bigger upside target if flip zone breaks
Resistance 1
$246.1
First resistance on a trendline breakout
Current Price
$212.7
Trading near support, below descending trendline
Support 1
$209.4
Key support, needs a swing high break to hold
Support 2
$200.60
Next support if $209.4 fails
$BCH Risk-Reward Table
Case
Trigger
Target
Bull Case
Holds $209.4, breaks recent swing high, sustains near the trendline, then clears the flip zone
Move toward $246.10 and $255.20.
Bear Case
Fails to close above the trendline
Slide toward $209.40 and $200.60.
Invalidation Level
This recovery setup would be invalidated if $BCH fails to close above the descending trendline and loses $209.4, opening the path down to $200.6.
This kind of failure is exactly what we outlined in our recentBCH falling today breakdown.
On the other side, a strong hold above $209.4 with a clean break of the trendline and the flip zone would confirm buyers are back in control and could accelerate the move toward $246.1.
Expert View
As per CoinGabbar market analyst, Bitcoin Cash is right at a make-or-break point near its current support zone, with a descending trendline still capping every attempt to push higher.
The $209.4 level is the one to watch closely, since holding it and breaking the recent swing high would set up a real shot at reclaiming the flip zone and pushing toward $246.1 and $255.2, a scenario we've laid out in more depth in ourBCH recovery scenario coverage.
Failure to close above the trendline, on the other hand, keeps the pressure on, and a loss of $209.4 would put $200.6 back in focus quickly, a risk we've also flagged in our broader look at whetherBCH sits near a critical zone right now.
For a real-time read on how this plays out, ourBCH price prediction today page tracks this trendline battle as it develops, and readers looking further ahead can also check our take on whether bulls can break BCH through higher levels down the line.
For the full picture on where things stand, see our completeBitcoin Cash price prediction coverage.
Disclaimer: This article is for informational purposes only and should not be considered financial advice. Cryptocurrency markets are highly volatile, and price predictions are not guaranteed. Please do your own research before making any investment decisions.