Key Takeaways Bitcoin exchange netflow turned slightly positive at about 556 BTC. Funding remains above its 30-day average, keeping long-side risk elevated. Open interest fell to about $21.02
Key Takeaways
- Bitcoin exchange netflow turned slightly positive at about 556 BTC.
- Funding remains above its 30-day average, keeping long-side risk elevated.
- Open interest fell to about $21.02B, showing partial leverage reduction.
- Distressed inflows suggest some underwater holders are moving coins to exchanges.
The current setup might be best read as neutral with a short-term risk bias. Bitcoin is no longer showing the same degree of leverage buildup seen earlier in the move, but the market has not fully reset either. Funding is still elevated, exchange flows have tilted slightly toward inflows, and distressed supply is becoming more visible.
That combination matters because each signal points to a different part of the market. Derivatives data show that some leverage has been cleared. Spot flow data show that coins are still reaching exchanges. Distressed inflow data adds the deeper layer: some of those coins appear to be moving at a loss, which usually reflects weaker holder conviction rather than ordinary portfolio rotation.
Why Distressed Inflows Matter More Than Normal Ones
Normal exchange inflows are not automatically bearish. Coins can move to exchanges for liquidity management, collateral use, rotation, or short-term trading. The Distressed Inflow Pressure Index is more specific because it focuses on how much incoming exchange supply is coming from coins already held at a loss, and how abnormal that pressure is compared with the past year.
That changes the interpretation. A simple inflow spike says BTC is moving to exchanges. A distressed inflow spike says underwater supply is moving to venues where selling becomes easier. When long-term holder coins are part of that flow, the signal becomes stronger because older coins usually move less often and tend to reflect higher-conviction holders.
Historically, similar distressed regimes have appeared around major washout periods, including the 2018 bear market and the 2022 deleveraging phase, per CryptoQuant report.
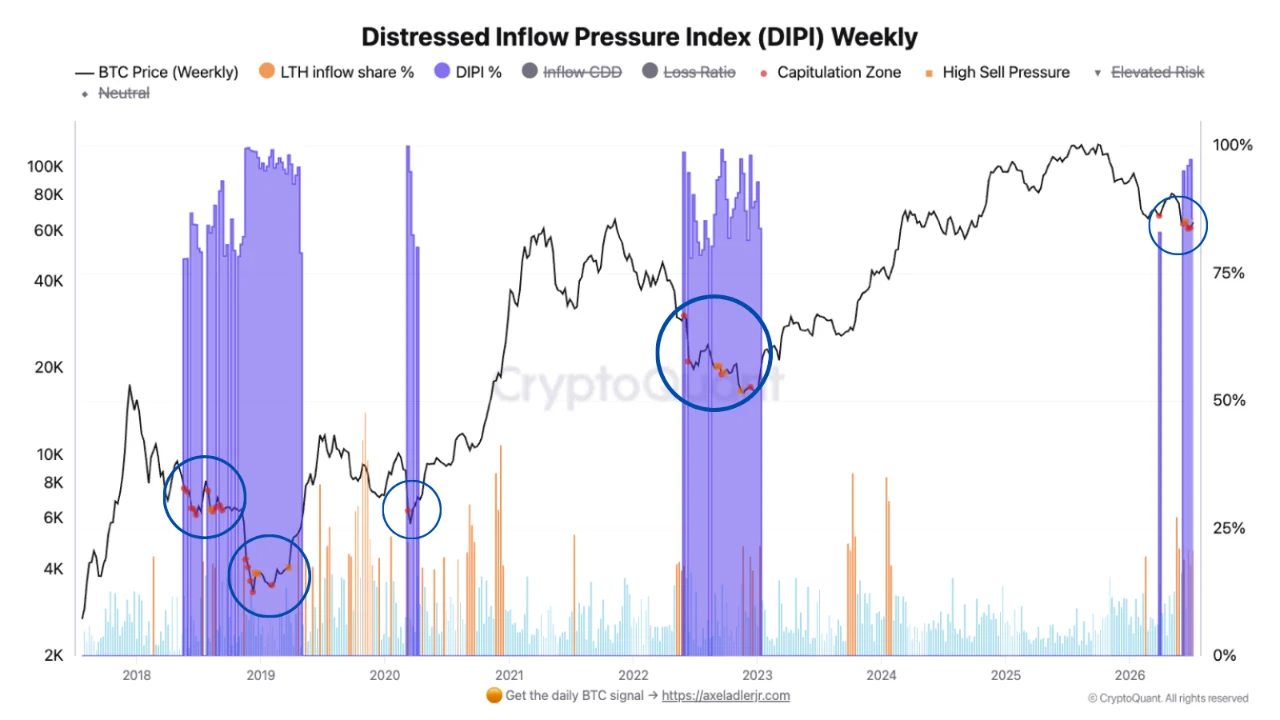
Historical analysis of the Distressed Inflow Pressure Index (DIPI) and its correlation with Bitcoin price capitulation zones.
That does not make the current signal a guaranteed bottom or a guaranteed breakdown. It shows that the market is dealing with stress supply, not just ordinary volatility.
The Data Shows Pressure, But Not Capitulation Yet
- Exchange netflow:Bitcoin’s exchange netflow turned positive at about 556 BTC, showing a slight inflow bias, but not enough to confirm sustained selling pressure.
- Seven-day netflow: The cumulative seven-day figure is only about 282 BTC, meaning exchange-side pressure is present but still limited.
- Funding rate:Funding remains elevated at 0.00719 at the time of writing, above the 30-day average of 0.00457, showing that long positioning is still crowded.
- Open interest: Open interest stands near $21.02 billion, down 1.3% on the day and roughly 4.3% from July 5, suggesting some leverage has been cleared.
- Realized price:Bitcoin’s realized price remains close to $53,000, showing little change in the broader market cost basis.
Taken together, the data shows a market that has cooled but not fully reset. Selling pressure is not aggressive yet, but funding remains high enough to keep the market vulnerable if exchange inflows persist.
The table explains why the signal is not one-dimensional. Exchange inflows have returned, but the seven-day total is still small. Open interest has declined, which means part of the speculative excess has been removed. At the same time, funding remains above its recent average, so the long side is still paying a premium to stay positioned.
This is why the setup is fragile rather than outright broken. Leverage has cooled, but not enough to call the derivatives market healthy. Spot pressure exists, but the netflow data does not yet show a large, persistent wave of exchange deposits. The risk is that both sides worsen at once: repeated inflows while funding and open interest rise again.
The Real Risk Is a Leverage-Supported Bounce Meeting Spot Supply
The weakest market structure appears when price rises mainly because traders add leveraged long exposure, while spot demand fails to absorb incoming supply. That is the risk now. Funding is still elevated, and some data points suggest Binance-linked leverage has been running hotter than the broader market.
If BTC continues higher while spot volume weakens and whale or distressed inflows keep rising, the rally becomes more vulnerable. The issue is not that every exchange deposit becomes a market sell. The issue is that leverage creates forced buyers on the way up and forced sellers on the way down. When that structure meets real coin supply, the market can reverse quickly.
READ MORE:
 Zcash Hits 80% Supply Milestone: What’s Next for ZEC?
What Might Confirm or Weaken the Signal
The bearish reading could strengthen if exchange inflows persist, funding stays elevated, and open interest begins rising again. That might suggest the market is rebuilding leverage before fully absorbing the existing supply pressure.
The risk view may weaken if exchange outflows resume, funding moves back toward its 30-day average, and open interest stabilizes without another aggressive buildup. That could show that the market is absorbing distressed supply rather than being overwhelmed by it.
Bitcoin is not showing a clean capitulation signal yet, but it is showing stress beneath the surface. The most important point is the split between partial deleveraging and unresolved spot-side pressure. Open interest has fallen, but long positioning remains expensive. Netflows are only modestly positive, but distressed inflows suggest some holders are moving coins under pressure.
That makes the next phase data-dependent. If distressed inflows fade while price stabilizes, the market may be absorbing the supply. If they remain elevated while BTC makes lower lows, the correction likely has not finished clearing weak hands.
This article is for informational purposes only and does not constitute financial or investment advice. Cryptocurrency markets are highly volatile. Always conduct your own research before making investment decisions.
The post Bitcoin Faces Stress Test as Exchange Inflows Rise appeared first on Coindoo.