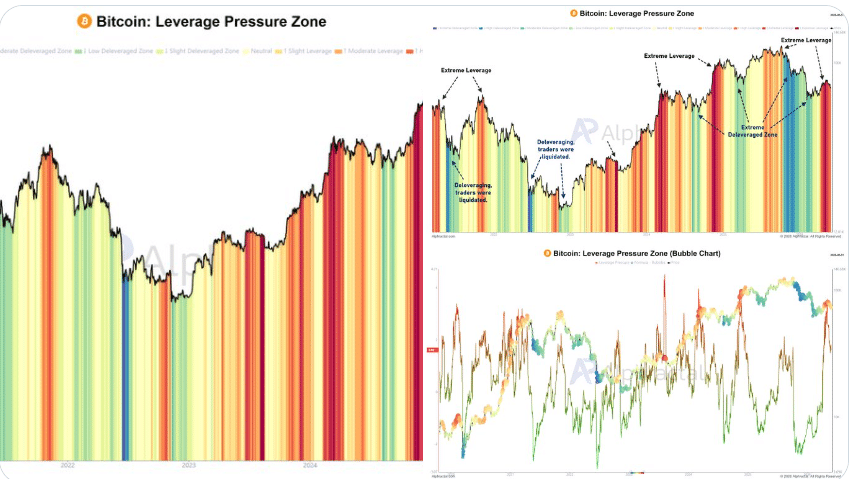
Bitcoin Leverage Pressure compares derivatives exposure against underlying capital support across exchanges. Red and dark red zones often appear before volatility spikes and liquidation-drive
- Bitcoin Leverage Pressure compares derivatives exposure against underlying capital support across exchanges.
- Red and dark red zones often appear before volatility spikes and liquidation-driven market moves.
- Low-pressure zones historically emerged after leverage resets and healthier market conditions.
Bitcoin Leverage Pressure has emerged as a new market framework measuring leverage against capital support, offering traders a broader view of potential liquidation risks and market stability.
Bitcoin Leverage Pressure Tracks Market Stress
CryptoQuant founder João Wedson introduced the Bitcoin Leverage Pressure model through X. The framework combines derivatives and on-chain data sources. It evaluates leverage relative to market capital support.
Source:
joao_wedson via X
The model uses information from 29 cryptocurrency exchanges. On-chain metrics are integrated with derivatives activity. This creates a wider view of market positioning.
According to Wedson's post, leverage pressure differs from traditional open interest. The model focuses on sustainability rather than raw leverage size. Capital backing becomes a central measurement.
The approach seeks to identify periods of excessive speculation. It measures when leverage expands beyond healthy levels. Such conditions often increase market vulnerability.
Color Zones Identify Changing Market Conditions
The framework categorizes market conditions through several color-coded zones. Green and blue represent low leverage pressure environments. These periods often follow broad liquidation events.
During these phases, speculative positions have typically declined. Market structures become less crowded with leverage. Historical observations showed healthier trading conditions.
Yellow zones represent more balanced market conditions. Leverage levels remain closer to underlying support. Risk conditions appear more neutral during these periods.

Orange, red, and dark red indicate elevated leverage pressure. These zones signal increasing market fragility. Traders become more exposed to liquidation-driven volatility.
Liquidity Remains the Core Market Driver
Wedson stated that markets naturally move toward liquidity. Crowded positioning often creates concentrated liquidation levels. These areas can attract future price action.
The chart presented alongside the model reflects repeating leverage cycles. Low-pressure environments gradually transition into higher-risk zones. Deleveraging phases eventually follow excessive leverage growth.
As of writing, readings show Bitcoin trading within elevated leverage-pressure territory. The chart displays recurring orange, red, and dark-red conditions. Similar periods historically coincided with heightened volatility.
The accompanying bubble chart reinforces this pattern. Larger bubbles appear near leverage extremes. These conditions often precede sharp market reactions and forced position unwinds.
The model does not predict immediate price direction. Instead, it measures the stability of existing market trends. Rising leverage pressure can signal increasing liquidation risk before price responds.
Wedson noted that leverage alone is not the primary concern. The relationship between leverage and supporting capital remains critical. Traders monitoring these conditions may identify changing risk environments earlier than traditional indicators.
The post Bitcoin Leverage Pressure Signals Rising Market Risk appears on Crypto Front News. Visit our website to read more interesting articles about cryptocurrency, blockchain technology, and digital assets.