Why BTC Bulls Are Losing Ground Despite Geopolitical Tailwinds Published June 18, 2026 Bitcoin found itself at a crossroads this week. The U.S.-Iran peace talks gave crypto markets a brief sh
Why BTC Bulls Are Losing Ground Despite Geopolitical Tailwinds
Published June 18, 2026
Bitcoin found itself at a crossroads this week. The U.S.-Iran peace talks gave crypto markets a brief shot of adrenaline, lifting BTC to the $65,000 range, but that rally is showing signs of running out of steam faster than most bulls expected. With the Federal Reserve holding rates steady and on-chain data painting a grim picture for miners, the short-term Bitcoin price prediction leans bearish heading into the coming weeks.
The U.S.-Iran Peace Talks: A Catalyst With a Short Shelf Life
Geopolitical optimism has a funny way of working in crypto. When tensions ease, risk assets tend to get a bump, and Bitcoin price is no exception to that pattern. The diplomatic momentum between Washington and Tehran helped push BTC off its recent lows, briefly reaching just beyond the $66,800 mark, which aligned with the 50% retracement level on the 4-hour chart. Traders interpreted the easing tensions as a green light to re-enter risk positions.
The problem is that optimism alone cannot sustain a rally when the underlying structure is fragile. Spot trading volumes during that move were notably thin, suggesting that the recovery was driven more by sentiment than by genuine institutional demand. When the crowd is moving on headlines rather than fundamentals, the bounce tends to be borrowed rather than earned.
U.S. stocks, in contrast, climbed toward all-time highs on the same peace talk energy. The divergence between equities and Bitcoin price is worth noting because it hints that BTC is carrying additional weight from its own structural issues that broader market optimism is not enough to offset.
Federal Reserve Holds Rates at 3.50%-3.75%, Warsh Stays the Course
The Federal Open Market Committee concluded its two-day meeting on June 17, with new Fed Chair Kevin Warsh announcing that interest rates would remain unchanged at the 3.50% to 3.75% range. This decision was widely expected, with the FedWatch Tool reflecting near-unanimous market consensus heading into the announcement.
For Bitcoin price, flat rates are a neutral-to-mildly-positive environment in theory, since tighter monetary policy has historically pressured speculative assets harder. But the Bitcoin price prediction remains clouded because the market had already priced in this outcome, leaving little room for a surprise catalyst to the upside. Short-term volatility around the announcement window played out, and BTC failed to break meaningfully higher.
Bitcoin Price Prediction: The $67,300 Ceiling and What Comes Next
Technical analysts watching the 4-hour chart have pointed to $67,300 as the potential high-water mark for this current move. The bearish swing structure visible from the weekly timeframe all the way down to the 4-hour confirms that sellers have maintained control through the recent recovery. The Bitcoin price prediction, based on that structure, suggests a probable retest of the $64,000 support zone, which has been marked as a critical level to watch.
A confirmed close below $64,000 would significantly raise the probability of a deeper move toward $59,100, the low that triggered the latest round of miner distress. Until buyers can reclaim the $70,000 resistance with real volume and conviction behind the move, the technical picture remains tilted toward the bears.
Miner Capitulation: The Hidden Weight Dragging BTC Lower
Bitcoin Price Prediction Turns Grim as Mining Pressure Intensifies
One of the most telling signals in the current market is what is happening at the miner level. Since last October, Bitcoin’s network hashrate has declined by 28%, a significant drop that reflects miners either shutting off machines or scaling back operations because running them is no longer profitable. When production costs sit around $76,000 and BTC is trading far below that figure, miners are effectively bleeding out with every block they produce.
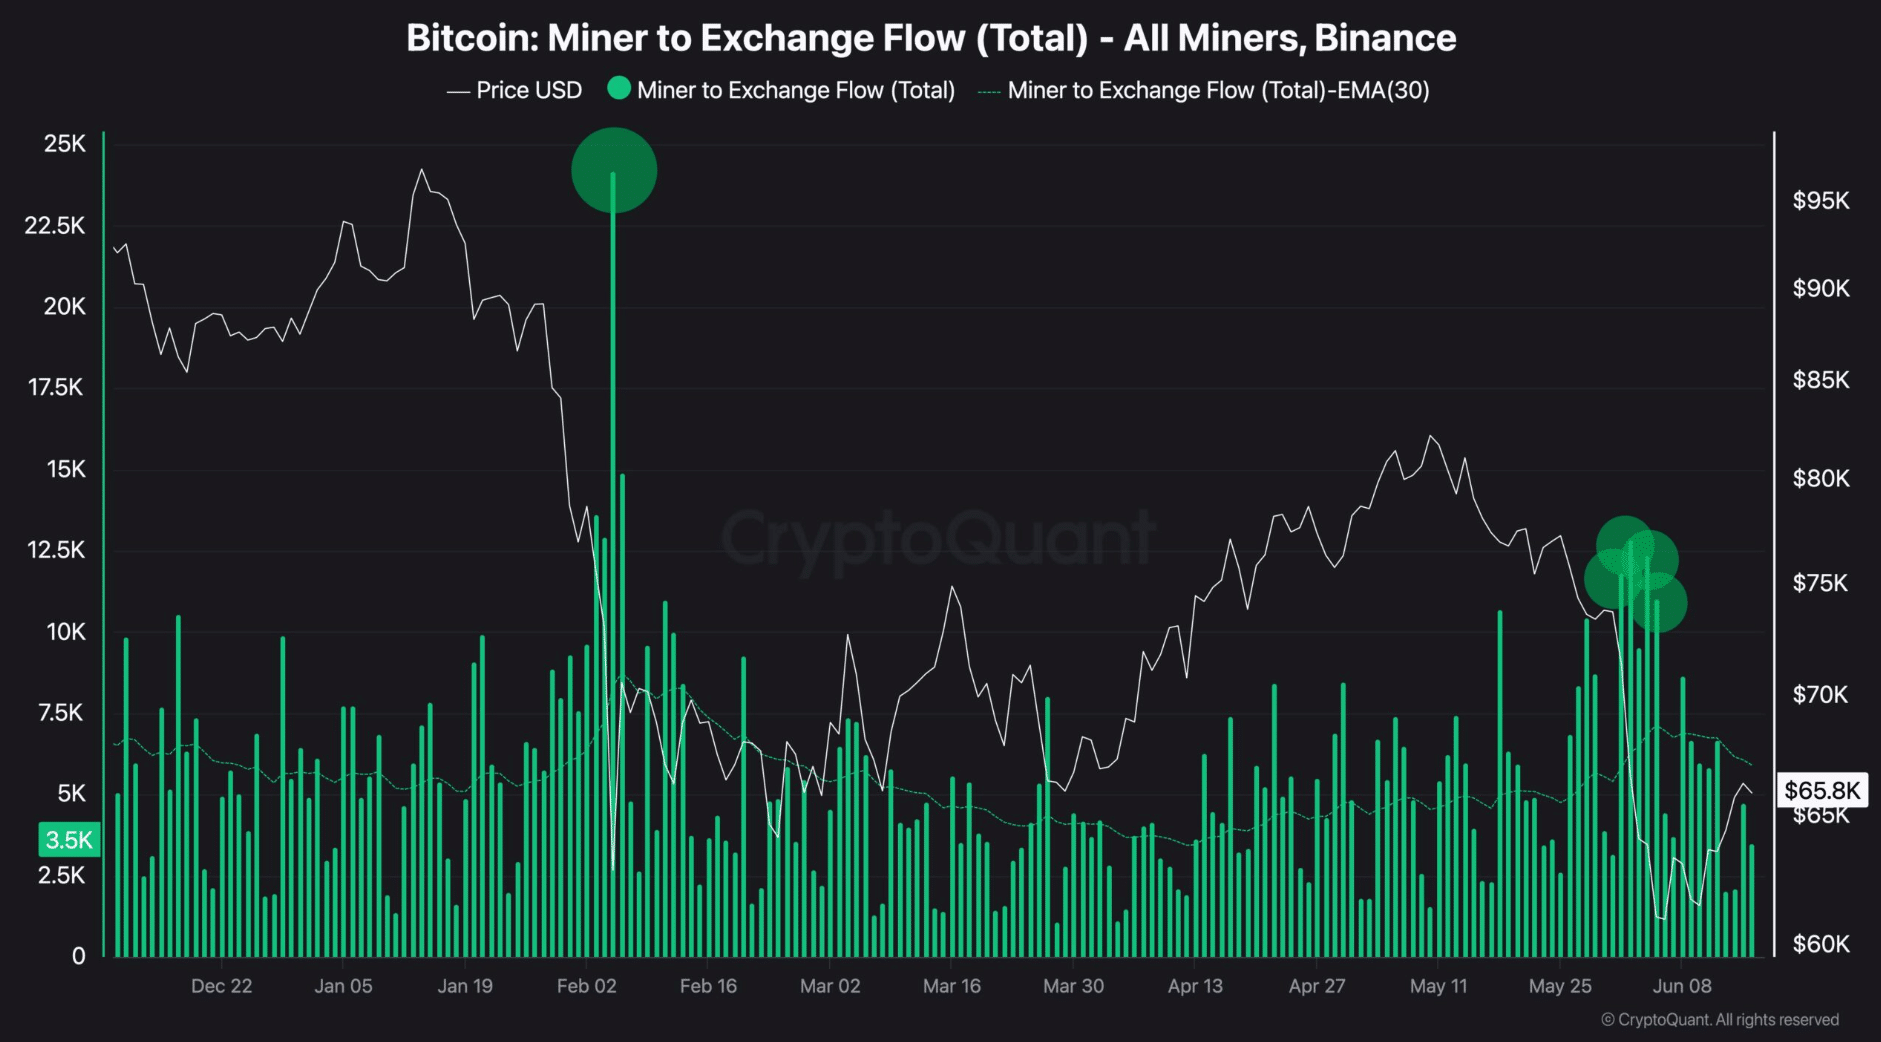
To cope, miners have been sending more BTC to exchanges, a behavior tracked through miner-to-exchange flow metrics. This pattern appeared in February and again earlier in June, and both instances preceded price weakness. It is a classic sign of forced selling where miners are not dumping because they want to, but because operational expenses leave them no choice.
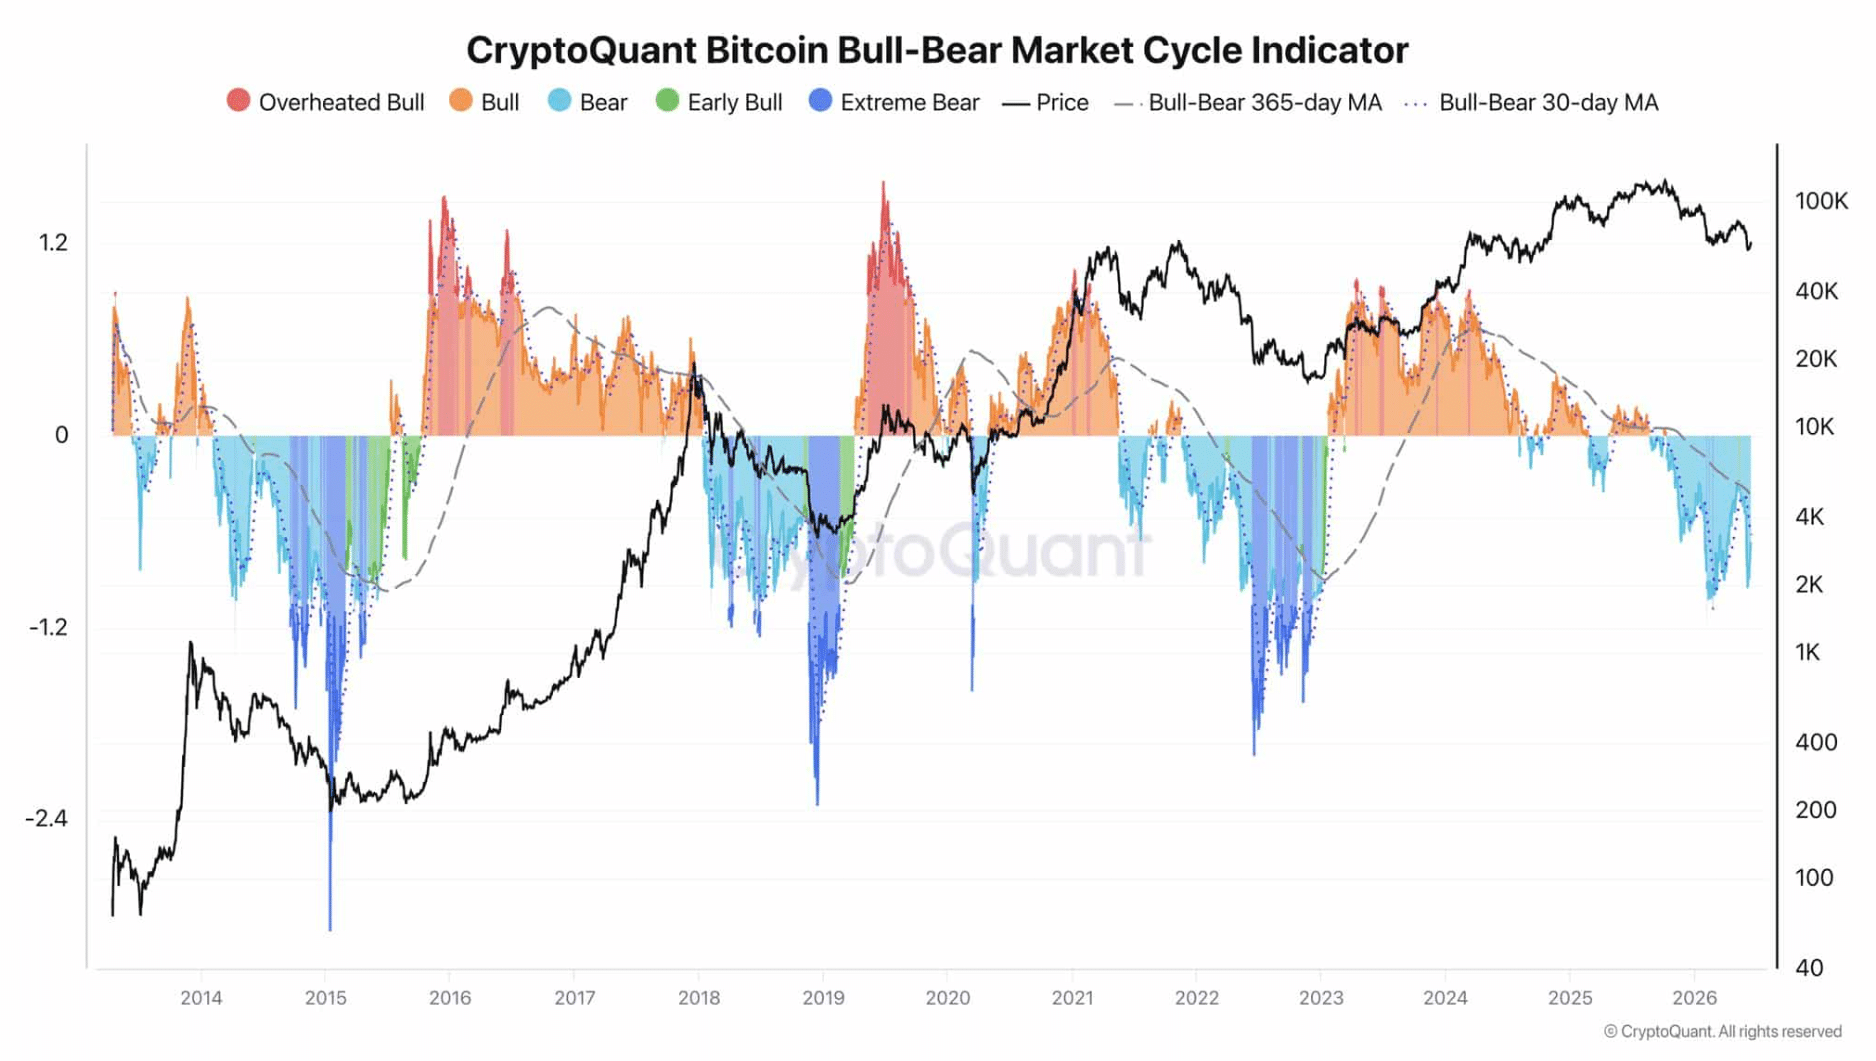
Analysts tracking these cycles have broken the market into five distinct phases, ranging from overheated bull at the peak to extreme bear at the bottom. Based on current metrics, the extreme bear threshold has not yet been crossed. That might sound like a silver lining, but it actually implies there could be more pain ahead before a genuine cycle bottom forms.
Conclusion
Bitcoin price is caught between two forces right now. Geopolitical optimism gave it a temporary lift, but thin volume, miner capitulation, and bearish technical structure are pulling in the opposite direction. The $64,000 level will be the line in the sand for the weeks ahead. If it holds, bulls might find their footing. If it breaks, the road to $59,100 reopens quickly. The Bitcoin price prediction for this period remains cautious, and the data supports patience over aggression for anyone watching from the sidelines.
Frequently Asked Questions
What is the current Bitcoin price prediction for June 2026? Based on technical analysis and on-chain data, analysts are cautious in the short term, with $64,000 identified as a key support level. A break below that level could trigger a move toward $59,100.
How did the U.S.-Iran peace deal affect Bitcoin? The peace talks helped push Bitcoin toward $65,000 to $66,800, but the rally lacked strong volume, suggesting the move was sentiment-driven rather than structurally supported.
Why are Bitcoin miners selling their holdings? With production costs around $76,000 and BTC trading below that, miners are operating at a loss and sending coins to exchanges to cover operational expenses, creating additional selling pressure.
What does the hashrate drop of 28% mean for Bitcoin? A declining hashrate indicates fewer miners are actively processing transactions, which reflects reduced profitability and signals broader market stress at the network level.
What is the Federal Reserve’s current interest rate? The Fed held rates steady at 3.50% to 3.75% following its June 2026 FOMC meeting under new Chair Kevin Warsh.
Glossary of Key Terms
Bitcoin Price Prediction: An analysis using technical, on-chain, and macroeconomic data to forecast where BTC is likely to trade in the near or medium term.
Hashrate: The total computational power miners are using to process Bitcoin transactions. A falling hashrate typically indicates declining miner participation.
Miner-to-Exchange Flow: A metric that tracks how much Bitcoin miners are sending to cryptocurrency exchanges, often used as a signal of selling pressure.
FOMC (Federal Open Market Committee): The policy-making body within the U.S. Federal Reserve responsible for setting interest rates.
Retracement Level: A price zone, often calculated using Fibonacci ratios, where an asset tends to pause or reverse during a pullback within a larger trend.
Capitulation: A market phase where investors or miners sell holdings under pressure, often marking the later stages of a bear cycle.
Swing Structure: A pattern on price charts formed by consecutive higher highs and higher lows (bullish) or lower highs and lower lows (bearish), used to identify trend direction.
Support Zone: A price level where buying interest has historically been strong enough to prevent further declines, acting as a floor for the asset.
Sources
CMEgropup
tradingview
Disclaimer: This article is intended for informational purposes only and does not constitute financial, investment, or trading advice.