What Is the Bitcoin Price Today? Bitcoin is trading near $78,145, down 1.32% in the last 24 hours. The Bitcoin Price Prediction Today points to a market stuck in a tight range, with traders w
What Is the Bitcoin Price Today?
Bitcoin is trading near $78,145, down 1.32% in the last 24 hours. The Bitcoin Price Prediction Today points to a market stuck in a tight range, with traders watching key U.S. economic data due later in the session.
Yesterday, BTC tried to push back above $80,000 but could not hold the gain. The rejection has left short-term traders cautious heading into today's session.
Bitcoin's market cap currently stands near $1.57 trillion, with circulating supply at 20.08 million BTC out of a max supply of 21 million. Spot trading volume over the last 24 hours is around $4.02 billion, while futures volume is much higher at $61.39 billion.
Market Metric
Value
Price
$78,145.1
24h Change
-1.32%
Market Cap
$1.57T
Circulating Supply
20.08M BTC
Max Supply
21.00M BTC
Futures Volume (24h)
$61.39B
Spot Volume (24h)
$4.02B
Open Interest
$53.33B
Why Is Bitcoin Price Down Today?
Two U.S. economic reports are in focus today: Producer Price Index (PPI) data and weekly unemployment claims.
Core PPI is expected to come in at 0.3%, up from 0.2% last month. Headline PPI is forecast at 0.4%, a jump from 0.0%. Unemployment claims are projected at 205,000, slightly below last week's 206,000.
Hotter inflation numbers could add pressure on risk assets like Bitcoin. Softer data, on the other hand, may give BTC some breathing room.
Are Bitcoin Whales Buying or Selling Right Now?
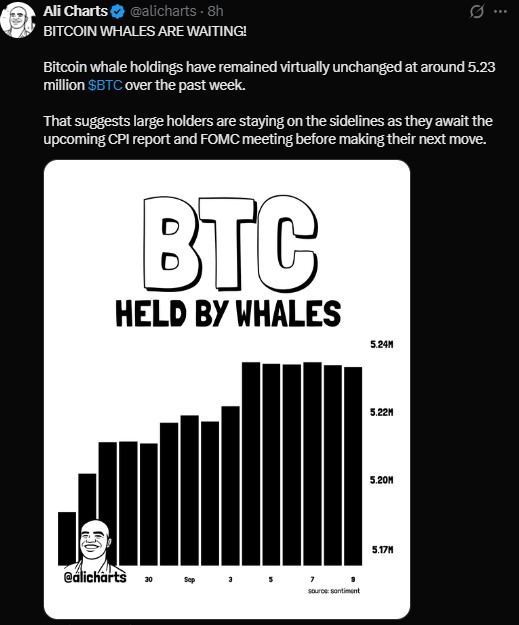
According to data shared by Ali Charts, Bitcoin whale holdings have barely moved this week, staying around 5.23 million BTC.
This flat trend suggests large holders are not making big moves right now. Most seem to be waiting for the upcoming CPI report and the Federal Reserve's FOMC meeting before taking a new position.
Metric
Data
Whale BTC Holdings
~5.23 million BTC
Weekly Change
Virtually unchanged
Next Catalyst
CPI report, FOMC meeting
Are Bitcoin ETF Inflows Slowing Down?
Institutional demand for Bitcoin has slowed down in recent days. Spot Bitcoin ETFs in the U.S. pulled in $770 million in net inflows between September 1 and September 4, based on SoSoValue data.
That streak reversed quickly. ETFs saw $46.65 million in net outflows on September 8, followed by another $120.24 million in outflows on September 9.
Date
ETF Flow
Sep 1-4
+$770 million (inflows)
Sep 8
-$46.65 million (outflows)
Sep 9
-$120.24 million (outflows)
Are Bitcoin Miners Selling Their Holdings?
Public Bitcoin miners have also been a source of supply this year. Reports show they sold between 28,000 and 32,000 BTC during the first half of 2026, worth close to $1.78 billion at the time.
Much of that cash went toward expanding into artificial intelligence and high-performance computing. More than $70 billion has reportedly gone into those projects, and this trend remains a supply factor traders should watch.
Will the Fed Raise Interest Rates in September 2026?
The next Federal Reserve meeting lands on September 16, 2026. The current target rate sits at 350-375 basis points.
Markets now price in a 60.4% chance of a rate hike to 375-400 basis points. That is a sharp jump from just a week ago, when the odds of a hike stood at 49.4%.
Scenario
Current Odds
Odds 1 Week Ago
No Change
39.6%
50.6%
Rate Hike (to 3.75-4.00%)
60.4%
49.4%
A rate hike is generally seen as a headwind for risk assets, including Bitcoin.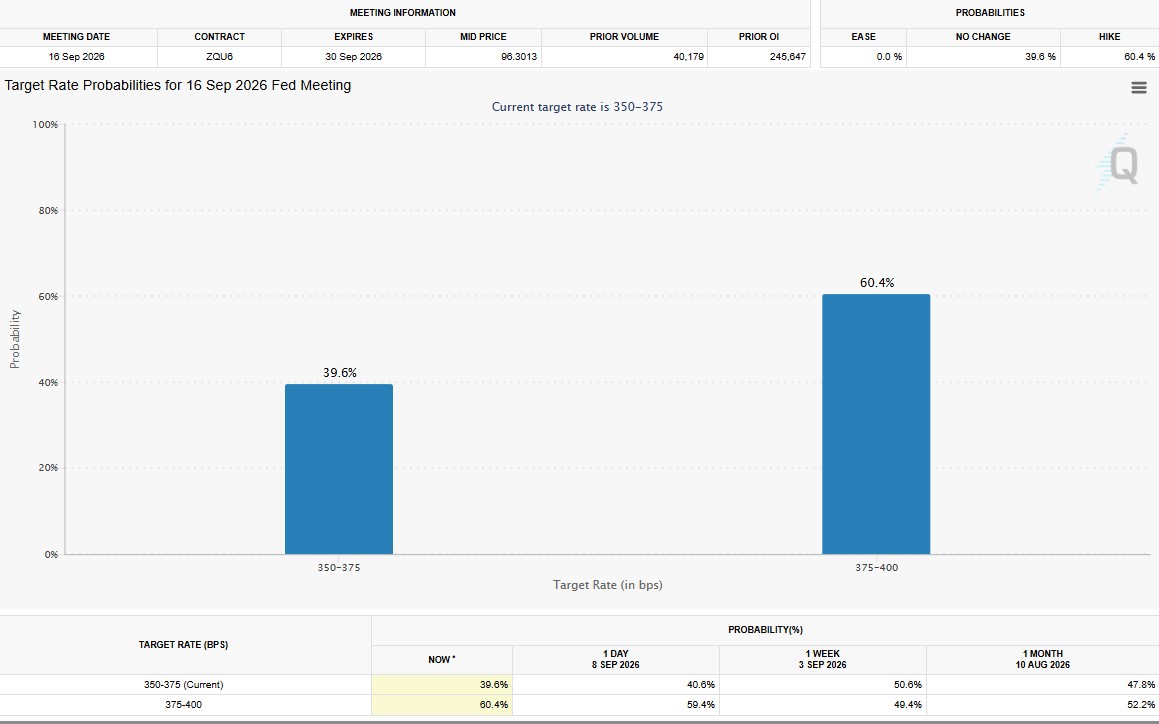
What Do Bitcoin Derivatives Show Today?
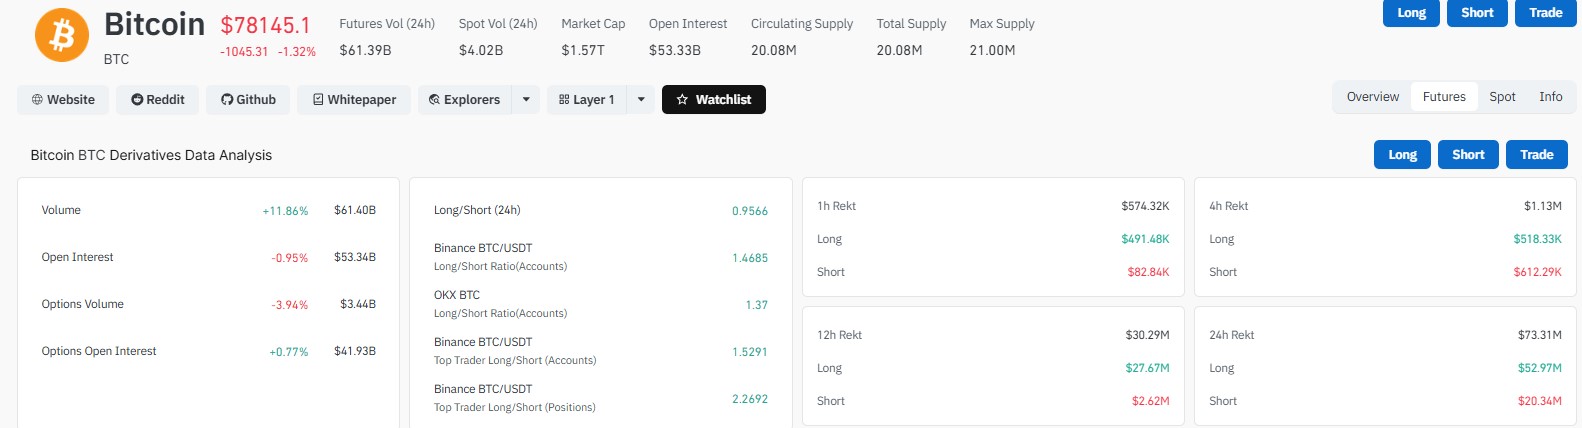
Bitcoin's derivatives market is showing signs of stress. 24-hour trading volume rose 11.86% to $61.40 billion, while open interest dipped 0.95% to $53.34 billion.
That mix, higher volume paired with lower open interest, often points to traders closing out positions rather than opening new ones.
Options volume fell 3.94% to $3.44 billion, while options open interest ticked up slightly by 0.77% to $41.93 billion.
The long/short ratio over 24 hours sits at 0.9566. On Binance, the BTC/USDT long/short account ratio reads 1.4685, and top traders show a position ratio of 2.2692. OKX's long/short account ratio stands at 1.37.
Derivatives Metric
Value
24h Change
Futures Volume
$61.40B
+11.86%
Open Interest
$53.34B
-0.95%
Options Volume
$3.44B
-3.94%
Options Open Interest
$41.93B
+0.77%
Long/Short Ratio (24h)
0.9566
-
How Much Was Liquidated in Bitcoin Today?
Liquidations over the past 24 hours totaled roughly $73.31 million. Long positions took the bigger hit at $52.97 million, compared to $20.34 million in short liquidations.
Shorter timeframes tell a similar story. Over the last 4 hours, long liquidations reached $518.33K against $612.29K in shorts. In just the last hour, longs were hit harder at $491.48K versus $82.84K in shorts.
Timeframe
Long Liquidations
Short Liquidations
1 Hour
$491.48K
$82.84K
4 Hours
$518.33K
$612.29K
12 Hours
$27.67M
$2.62M
24 Hours
$52.97M
$20.34M
Where Is Bitcoin Price Headed Next?
Looking at the daily chart, Bitcoin is consolidating after its sharp breakout from the $64,000 zone back in May. Price is currently hovering around $78,200.
Resistance sits in the $81,500 to $82,500 range. Support is holding near $76,000 to $77,000.
The RSI reads near 59, showing momentum is still positive but starting to cool off. That raises the chance of a rejection if BTC tests the upper resistance zone again.
The 20-day and 50-day EMAs are clustered around $72,700 to $72,900. BTC remains well above both, keeping the broader medium-term trend intact.
A Golden Cross, where the 50-day EMA crosses above the 200-day EMA, would be a strong bullish confirmation signal. A bearish crossover would suggest fading momentum instead.
Bearish Scenario
If Bitcoin fails to close above $82,000-$83,000, a pullback becomes more likely.
A rejection could send BTC back toward $76,000-$77,000
A daily close below that support opens the door to $73,000-$74,000, near the EMA cluster
If that zone breaks too, the next target is $70,000-$71,000, then $66,000-$68,000
Bullish Scenario
The bearish case would lose weight if Bitcoin closes strongly above $82,500-$83,000, especially above the 200-day EMA.
A confirmed breakout could open the path to $86,000-$88,000
Beyond that, $90,000+ becomes a realistic target
What Are the Key Bitcoin Price Levels to Watch?
Level Type
Price Zone
Major Resistance
$82,500 - $83,000
Minor Resistance
$81,500 - $82,500
Current Price
~$78,145
Minor Support
$76,000 - $77,000
Major EMA Support
$72,700 - $72,900
Deeper Support
$70,000 - $71,000
Overall, the setup leans toward a short-term pullback unless Bitcoin can clear $83,000 with strong volume. The longer-term structure still looks constructive as long as BTC holds above its major EMA support levels.
Senator Cynthia Lummis has also urged the Senate to pass the CLARITY Act, which could add a fresh regulatory catalyst if it moves forward.
Disclaimer
This article is for informational purposes only and does not constitute financial, investment, or trading advice. Cryptocurrency markets are highly volatile and carry significant risk. Prices mentioned are subject to change rapidly. Always conduct your own research and consult a licensed financial advisor before making any investment decisions. Past performance is not indicative of future results.