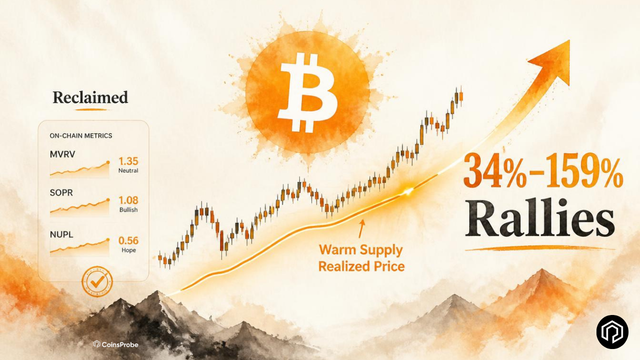
Key Highlights Bitcoin has reclaimed its Warm Supply Realized Price — the average cost basis of BTC held for 1 week to 6 months — a signal that has preceded rallies of +69%, +159%, +74%, and
Key Highlights
- Bitcoin has reclaimed its Warm Supply Realized Price — the average cost basis of BTC held for 1 week to 6 months — a signal that has preceded rallies of +69%, +159%, +74%, and +34% in the four prior instances since 2023.
- Analyst consensus has flipped constructive — Unbias data shows a monthly BUY reading (+35 tilt, 112 analysts) and hourly STRONG BUY (+54, 52 opinions) as of September 8, 2026 — alongside a confirmed Bitcoin golden cross.
- BTC is trading at $78,911 — up 21.24% over 30 days — holding just below $80,000 with the key test being whether the warm supply reclaim holds and $80,000 converts from resistance to support.
Bitcoin is not just holding near $80,000 — it is doing so while two independent signals are aligning behind the move. The first comes from on-chain analyst Ali Charts (@alicharts), who flagged that Bitcoin has reclaimed its Warm Supply Realized Price — a metric that has preceded four consecutive rallies ranging from 34% to 159% since January 2023. The second comes from aggregated analyst sentiment, which has shifted from deeply negative to Buy and Strong Buy alongside the recovery.
At the time of writing, BTC is trading at approximately $78,911 — up 0.39% in 24 hours and 21.24% over 30 days — with a market capitalization of approximately $1.58 trillion.
 Bitcoin (BTC) Price on 09 Sept 2026 | Source: Coinmarketcap
Signal 1 — Warm Supply Realized Price Reclaimed
The most structurally significant on-chain development flagged this week comes from Ali Charts (@alicharts) via Glassnode data: Bitcoin has reclaimed its Warm Supply Realized Price — and the historical track record of this specific event is one of the cleanest trend signals Bitcoin’s on-chain toolkit has produced.
What the Warm Supply Realized Price Measures
The Warm Supply Realized Price tracks the average cost basis of Bitcoin that last moved between 1 week and 6 months ago — the breakeven level for the most recently active portion of the Bitcoin supply, excluding both short-term traders (under 1 week) and long-term holders (over 6 months).
This cohort — often described as “warm” holders — represents the most behaviorally relevant group for near-term price dynamics. They are not day traders who might sell on any intraday move, and they are not diamond-handed long-term holders who are unlikely to sell at all. They are the active market participants whose profit/loss position most directly influences near-term selling pressure.
When price is below the warm supply realized price: This cohort is underwater — experiencing unrealized losses that create latent selling pressure as holders look for opportunities to exit at or near breakeven.
When price reclaims the warm supply realized price: This cohort moves back into profit — reducing the urgency to sell and historically marking a shift from distribution to accumulation dynamics in the near-term supply structure.
The Four-Signal Track Record
Ali Charts’ analysis documents four prior instances where Bitcoin reclaimed the Warm Supply Realized Price after trading below it — and the subsequent rallies in each case:
DateSignalSubsequent RallyJanuary 2023Warm Supply Reclaim+69%October 2023Warm Supply Reclaim+159%October 2024Warm Supply Reclaim+74%April 2025Warm Supply Reclaim+34%September 2026Warm Supply ReclaimPending
The range of outcomes across the four prior instances — from +34% to +159% — reflects different macro environments and cycle phases. But the consistency of the directional outcome (positive in all four cases) across a four-year period spanning two distinct market cycles is what gives the current reclaim its analytical weight.
As covered in our CryptoQuant Bitcoin bear cycle declared over analysis, the broader on-chain regime has already transitioned from bear to early bull — with the Bull Score reaching 80 and 8 of 10 underlying indicators flashing bullish. The warm supply realized price reclaim adds a specific and historically grounded demand-side confirmation to that broader regime shift.
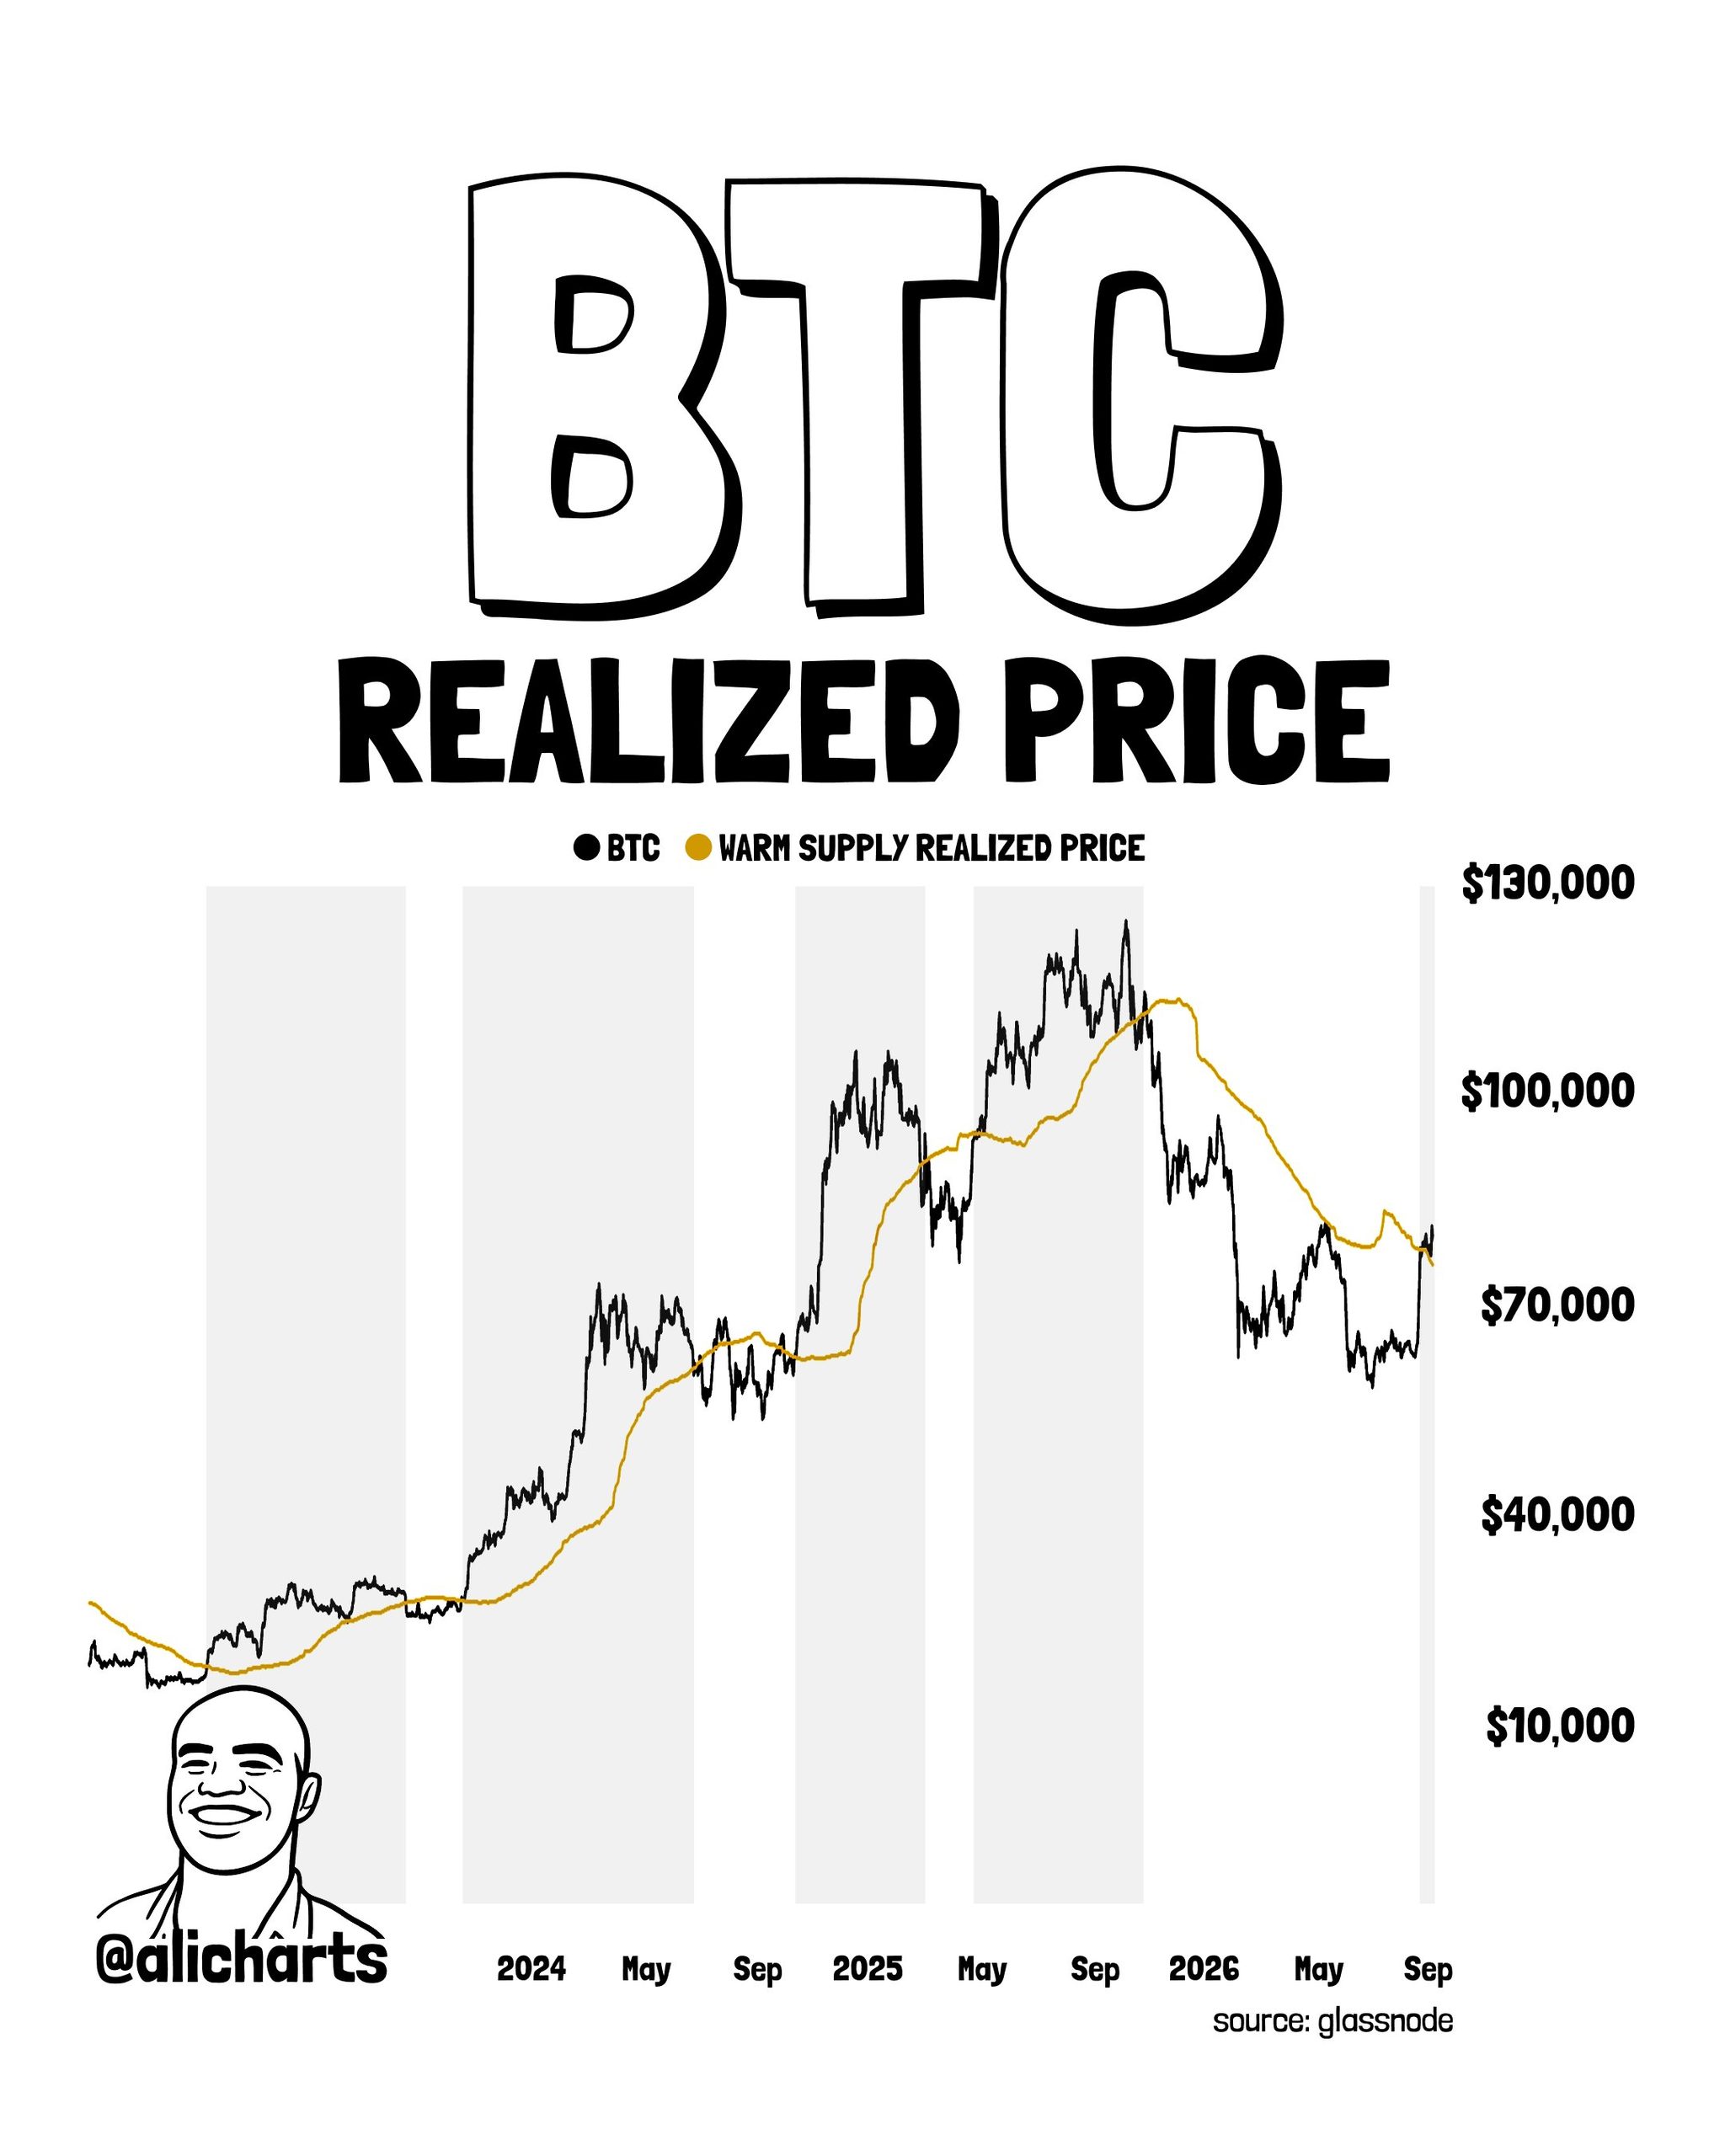 Bitcoin Warm Supply Realized Price | Source: @alicharts (X)
The Glassnode Chart — What It Shows
The Glassnode-based chart shows the price-to-warm-supply-realized-price relationship across the full 2023–2026 period. The pattern is visible: Bitcoin slipped below the warm supply cost basis during the 2026 drawdown (when price declined toward the $60,000 range), then pushed back through it as price recovered toward the high-$70,000s. The current reclaim — with price at $78,911 — represents the fifth time this specific cost basis level has been crossed from below since 2023.
Ali called the reclaim “another strong bullish signal” for BTC — framing it as part of the accumulating body of on-chain evidence that the current recovery is structurally sound rather than a temporary bounce.
Signal 2 — Analyst Consensus Flips to Buy and Strong Buy
The second signal comes from a different analytical dimension — aggregated market sentiment rather than on-chain cost basis data.
Unbias data as of September 8, 2026 shows analyst sentiment has shifted materially alongside Bitcoin’s recovery from the mid-year lows near $60,000:
TimeframeConsensus ReadingBullish TiltAnalysts SurveyedMonthlyBUY+35112 analystsHourlySTRONG BUY+5452 opinions
The Analyst Consensus Index chart shows the reading flipping back to green — positive territory — as Bitcoin recovered from its 2026 lows. The transition from deeply negative consensus readings (visible during the correction phase) to the current BUY/STRONG BUY configuration represents the broadest analyst alignment behind Bitcoin that has been seen since the mid-year decline began.
 Bitcoin Analysts Consensus Index | Source: @ki_young_ju (X)
What the Consensus Data Is Also Showing
Beyond the BUY reading, the Unbias dashboard highlights a confirmed Bitcoin golden cross — the 50-day moving average crossing above the 200-day moving average — as a top narrative among the analysts contributing to the consensus reading. The golden cross is one of the most widely watched technical trend indicators and its confirmation alongside the on-chain warm supply reclaim creates a technical-plus-on-chain alignment.
As covered in our Bitcoin reclaims 1,130-day SMA after 80 days below analysis, the technical structure has been progressively reclaiming key long-term levels throughout August — the 1,130-day SMA reclaim on August 20 being the most historically significant. The golden cross confirmation and warm supply realized price reclaim add two more layers to that technical recovery stack.
The Important Caveat — Consensus Can Lag Price
The shift in analyst consensus is constructive — but it carries an important limitation worth acknowledging directly. A BUY reading after a 21% monthly bounce is partially a reaction to the move that has already been made rather than a leading indicator of the move ahead. Analysts are human — sentiment aggregates tend to follow price rather than lead it, particularly after sharp directional moves.
The distinction between the warm supply realized price signal (on-chain, objective, leading) and the analyst consensus shift (sentiment-based, partially reactive) is important for weighting the two signals appropriately. The on-chain signal is the more analytically robust of the two. The consensus shift is confirmation rather than the primary driver.
That said, the transition from the deeply negative consensus readings that characterized the 2026 correction to the current BUY/STRONG BUY configuration is a meaningful shift — even accounting for the lag. It reflects a genuine change in how the analyst community is framing Bitcoin’s near-term trajectory.
What the Two Signals Together Are Saying
The warm supply realized price reclaim and the analyst consensus flip are not measuring the same thing — one is an objective on-chain cost basis metric, the other is an aggregated human sentiment reading. Their simultaneous alignment is what creates the combined signal worth noting.
The warm supply reclaim says: The most actively traded portion of Bitcoin’s supply has moved back into profit — reducing near-term selling pressure structurally and historically marking the beginning of expansion phases in four prior instances.
The consensus flip says: The analyst community — 112 observers on a monthly basis and 52 on an hourly basis — has shifted its collective view from negative to constructive alongside the on-chain recovery.
Together they describe a Bitcoin market where both the objective on-chain supply dynamics and the human analytical community are pointing in the same direction at the same time — a configuration that is more robust than either signal in isolation.
As documented in our Bitcoin spot demand ETF inflows and Binance $2.63B absorption analysis and Bitcoin highest demand of 2026 and 12-month RSI reset analysis, the August–September 2026 recovery has been progressively adding independent confirmation layers — spot demand, futures activity, on-chain regime shift, technical moving average reclaims, and now warm supply cost basis recovery. Each layer narrows the range of outcomes consistent with the data.
Bullish vs. Bearish Scenarios
Bullish Scenario
Bitcoin holds the warm supply realized price reclaim on a sustained basis — price maintaining above the high-$70,000s cost basis level rather than retreating back below it. A sustained daily close above $80,000 converts that level from resistance to support, confirming the reclaim is holding. The subsequent path follows the prior four warm supply reclaim instances toward a sustained expansion phase, with the $83,000 365-day MA as the next major confirmation level. Analyst consensus sustaining at BUY and the golden cross holding provide technical and sentiment confirmation of the trend.
Bearish Scenario
Bitcoin loses the warm supply realized price level — declining back below the high-$70,000s cost basis and pushing the warm supply cohort back into unrealized loss territory. This would break the five-signal track record of the warm supply reclaim and indicate that the current recovery has not yet built the structural foundation to sustain the trend. A return to the $72,000–$74,000 range would represent a partial retracement while keeping the broader bull market thesis intact. A sustained close below $70,000 would weaken the macro recovery narrative more significantly.
Bottom Line
Bitcoin’s reclaim of the Warm Supply Realized Price is the most specific and historically grounded on-chain signal the current recovery has produced. Four prior instances across 2023–2025 — each following a period of price trading below the warm supply cost basis — produced rallies of +69%, +159%, +74%, and +34% respectively. The current reclaim is the fifth.
Analyst consensus shifting to BUY and STRONG BUY across 112 and 52 observers respectively adds sentiment confirmation to the on-chain signal — with the additional backdrop of a confirmed golden cross providing technical alignment.
The immediate test is $80,000 — whether Bitcoin can convert that level from resistance to support and sustain the warm supply reclaim that history suggests is an early signal rather than a late one.
Disclaimer: The views and analysis presented in this article are for informational purposes only and reflect the author’s perspective, not financial advice. Technical patterns and indicators discussed are subject to market volatility and may or may not yield anticipated results. Investors are advised to exercise caution, conduct independent research, and make decisions aligned with their individual risk tolerance.
Also Read: Bitcoin (BTC) Rallies 25% as Spot ETFs and CEX Lead Fresh Capital Inflows