Key Highlights Bitcoin trades at $68,561 (-6.90% 24h) as Binance BTC open interest collapses 17% from $10.6B to $8.8B in under one month August, September, and October recorded the three high
Key Highlights
Bitcoin trades at $68,561 (-6.90% 24h) as Binance BTC open interest collapses 17% from $10.6B to $8.8B in under one month
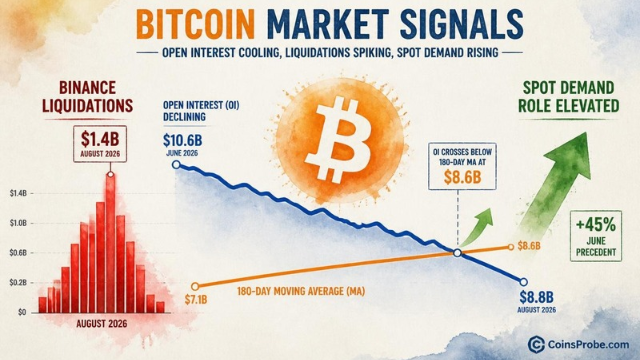
August, September, and October recorded the three highest monthly Binance liquidation totals since 2021 — $1.4B, $1.1B, and $1.3B respectively
A comparable deleveraging signal appeared in June when BTC was below $60,000 — a rebound above $87,000 (+45%) followed per CryptoQuant
Bitcoin is trading at approximately $68,561 — down 6.90% in the past 24 hours — but an on-chain signal published by CryptoQuant suggests the sell-off may be clearing the conditions for a structurally stronger market. The mechanism is not price action itself. It is what is happening beneath it: the largest deleveraging event on Binance since 2021.
An on-chain analyst at CryptoQuant, writing under the handle @Darkfost_Coc, identifies the collapse in Binance open interest as a signal that excess leverage is being flushed from the market. In his exact words: “Reducing leveraged positions lowers the risk of cascading liquidations and can give spot demand a greater role, helping build a stronger market structure for Bitcoin.” This is not a price prediction. It is a structural observation — and the data behind it is specific.
In less than one month, Bitcoin open interest on Binance has fallen from $10.6 billion to $8.8 billion — a decline of 17%. Over the same period, the 180-day moving average of open interest has risen from $8.4 billion to $8.6 billion. The result: open interest has crossed below its own 180-day moving average, triggering what CryptoQuant’s analyst designates as a formal deleveraging signal.

Binance BTC Deleveraging Analysis | Source: @cryptoquant_com (X)
The significance of this crossover is contextual. During genuine bear markets, the analyst notes, this process can persist for several months. But outside bear markets — specifically during bull-market corrections — a comparable signal appeared in June of this cycle, when Bitcoin was trading below $60,000. What followed was a rebound above $87,000, a gain of more than 45%. The current signal is appearing at structurally similar open interest conditions: open interest declining through its moving average as monthly liquidation volumes reach multi-year highs.
The scale of the liquidation data is what makes this deleveraging event distinct. According to CryptoQuant’s published analysis, the past three months recorded the highest monthly liquidation totals on Binance since 2021. August logged more than $1.4 billion in liquidations — the highest of the three. September followed at $1.1 billion. October came in at $1.3 billion. November, with the month not yet complete at time of writing, has already exceeded $520 million before the halfway point.
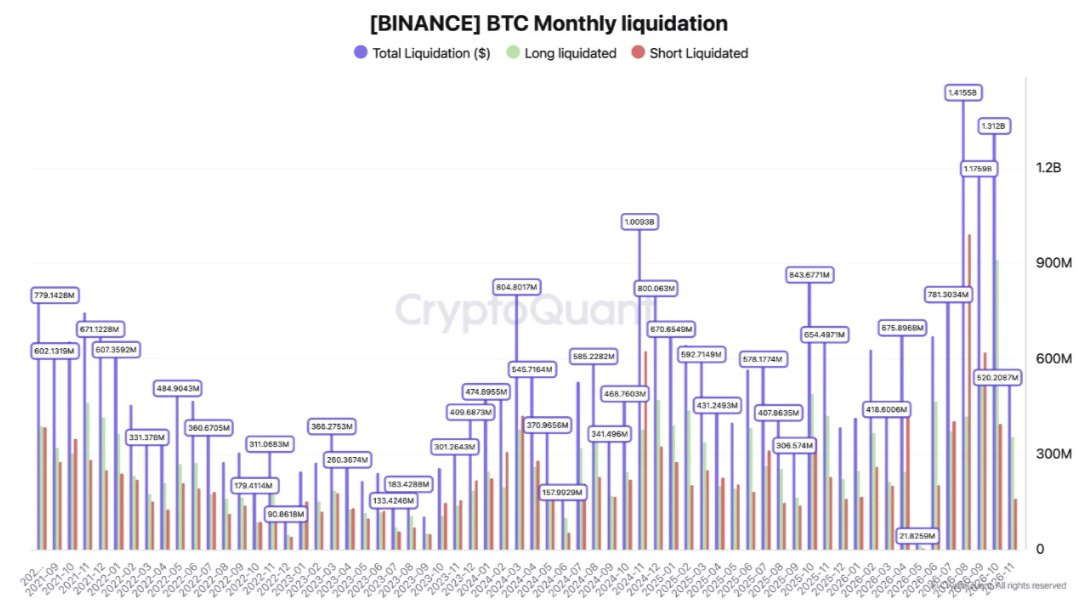
BTC Monthly Liquidations (Binance) | Source: @cryptoquant_com (X)
The analyst’s explanation for why liquidations reached these levels is precise: low volatility appears to have encouraged traders to increase leverage to compensate for smaller price movements, leaving positions more exposed to reversals when volatility eventually returned. That dynamic — patience-driven overleveraging in a compressed volatility environment — is now unwinding. The broader market has seen similar technical stress across assets in this period.
A 6.9% single-day decline reads as bearish on a price chart. The open interest data reframes it. When leverage is the primary driver of a drawdown — rather than fundamental selling — the cleanup of that leverage is a precondition for spot-driven demand to reassert itself. CryptoQuant’s analyst makes this distinction explicit: the reduction in leveraged exposure, whether voluntary or through forced liquidation, reduces the probability of cascading liquidations in subsequent sessions. Cascading liquidations are the mechanism through which leveraged markets overshoot to the downside. Remove the leverage, and that cascade mechanism is defused.
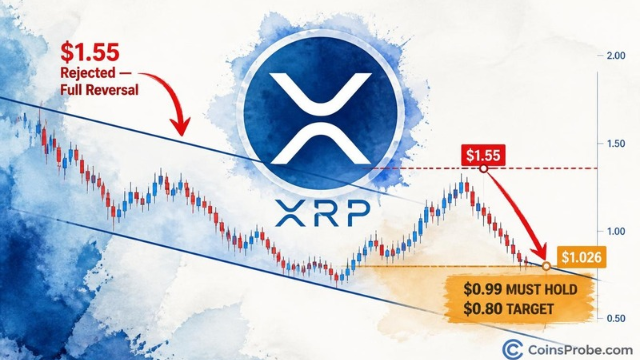
The analyst frames the outcome in structural terms: spot demand gains a proportionally larger role in price discovery when leveraged positioning is reduced. Bitcoin traded above $87,000 after the June deleveraging signal — a 45%-plus move from the sub-$60,000 entry zone. The current signal does not guarantee a repeat of that magnitude, but it confirms the same structural clearing process is underway. Traders watching for a comparable setup in other risk assets should note the mechanism is market-structure specific — it applies where leveraged futures dominate price discovery.
The CryptoQuant analysis confirms three things with precision: open interest on Binance has declined 17% in under one month, falling from $10.6 billion to $8.8 billion; the 180-day moving average has simultaneously risen to $8.6 billion, creating the crossover signal; and monthly liquidation volumes for August, September, and October are the three highest since 2021, at $1.4 billion, $1.1 billion, and $1.3 billion respectively.
What it does not confirm: a price floor, a reversal date, or a specific upside target. The analyst draws the June-to-$87,000 precedent as an illustrative historical parallel, not a projected outcome. The signal is a structural condition — leverage cleared, cascade risk reduced, spot demand elevated in relative importance — not a timing call. Whether spot demand materializes at current levels or requires further price discovery lower is not addressed by the open interest data alone. The technical structure across the broader crypto market will play an equal role in determining when buyers commit.
The one level the data does establish is $8.8 billion in Binance open interest — the current floor of the deleveraging. If open interest stabilizes here and begins recovering while the 180-day moving average holds at $8.6 billion, the structural clearing phase is complete. Watch $8.8 billion in Binance BTC open interest as the floor that determines whether this deleveraging has run its course or has further to go.
Disclaimer: The views and analysis presented in this article are for informational purposes only and reflect the author’s perspective, not financial advice. Technical patterns and indicators discussed are subject to market volatility and may or may not yield the anticipated results. Investors are advised to exercise caution, conduct independent research, and make decisions aligned with their individual risk tolerance.
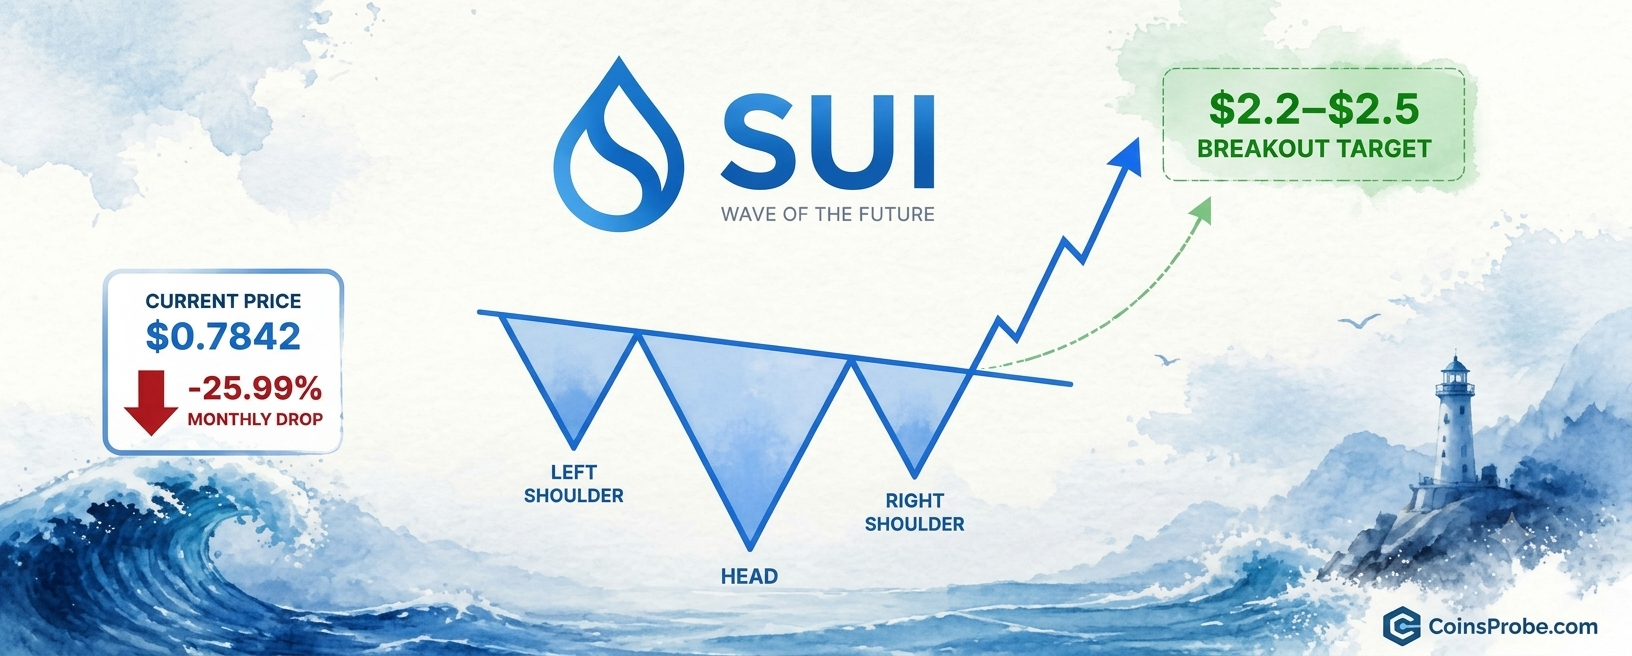
Also Read: SUI Inverse Head & Shoulders Forms — Breakout Target Is $2.2–$2.5