Bitcoin technical analysis remains focused on whether the cryptocurrency can establish a reliable floor above the critical $60,000 support zone. Recent price action has provided short-term re
Bitcoin technical analysis remains focused on whether the cryptocurrency can establish a reliable floor above the critical $60,000 support zone. Recent price action has provided short-term relief following a sharp market decline, but several indicators suggest that confirmation of a durable market bottom remains absent.
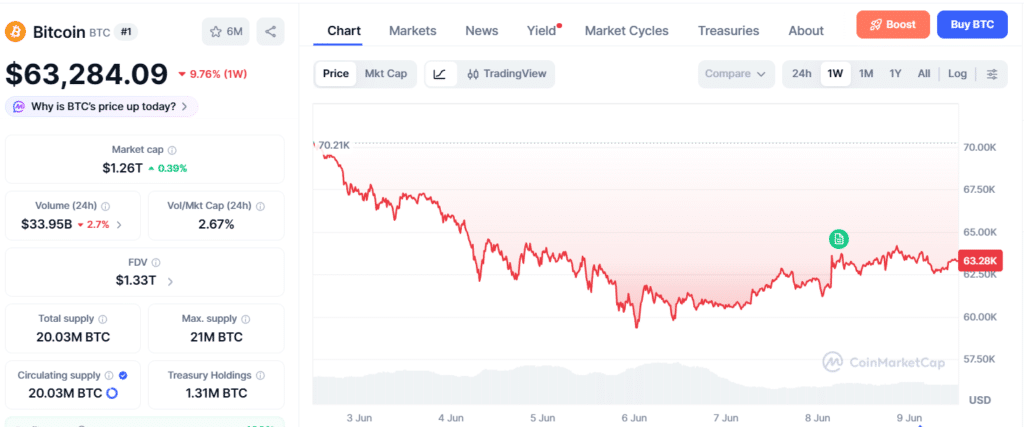
Market participants continue to assess technical, derivatives and on-chain signals to determine whether selling pressure is nearing exhaustion. Historically, major Bitcoin bottoms have formed when these indicators begin moving in the same direction. Bitcoin is currently trading around $63,233.18, up 0.44% over the past 24 hours while remaining down 9.93% over the last seven days.
The asset’s market capitalization stands at $1.26 trillion, with 24-hour trading volume reaching $34.48 billion. The latest recovery has sparked debate over whether buyers are gradually regaining control or whether the rebound could fade without stronger support from capital inflows and market participation.
How Does Bitcoin Technical Analysis Describe The Current Market Structure?
Bitcoin technical analysis suggests that buyers continue to defend the closely watched $60,000 area, though the broader setup remains fragile. A confirmed Bitcoin bottom generally requires alignment between technical indicators and on-chain data. That confirmation has yet to appear.
Bitcoin Technical Analysis: Is BTC’s $60K Support a Bull Trap as $55K Risk Grows? 3
Over the past three days, nearly $1 billion has been added to Bitcoin Open Interest (OI), representing a three-day increase in speculative positioning and leverage across the market. This recent increase should not be confused with total open interest. CoinGlass data shows total Bitcoin open interest currently stands at approximately $45.38 billion, highlighting the scale of leveraged exposure in futures markets.
The broader technical structure remains under pressure. Since Bitcoin’s rally to $82,000 in mid-May, the market has recorded three lower lows. The pattern suggests previous support levels have struggled to attract sustained buying demand and have instead been followed by long liquidations.
Why Is The $60,000 Level Being Closely Watched?
The $60,000 region has become one of the most important levels on Bitcoin’s chart because it may determine whether the market stabilizes or faces another wave of selling. Many traders view this area as a potential floor that could prevent a deeper decline toward the $50,000 range.
However, several confirmation signals remain absent. Bitcoin technical analysis shows that funding rates remain positive across major perpetual futures markets, indicating that traders continue to maintain a bullish bias. Positive funding rates can support upside momentum, but they can also signal crowded long positioning that becomes vulnerable if support levels break.
One constructive development emerged on June 7 when Bitcoin gained more than 4%, suggesting that buyers were willing to step in during the decline. That rebound remains one of the stronger bullish signals within the current market structure.
Are Market Flows Supporting A Sustainable Recovery?
Flow data continues to present a cautious picture. ETF flows remain negative despite Bitcoin consolidating around the $60,000 region. If that trend persists, it could reinforce a risk-off backdrop. Conversely, a reversal back to sustained positive inflows would likely strengthen the case for a more durable recovery.
Bitcoin technical analysis often treats capital inflows as a key confirmation factor because strong rallies are typically supported by consistent demand. Without that support, recoveries can struggle to maintain momentum over longer periods.
Bitcoin has also shown a reported 77% correlation with the Nasdaq-100 during the recent market rebound, highlighting the continued influence of broader macroeconomic sentiment on crypto assets. Some market participants have attributed the latest recovery to broader risk-asset stabilization, institutional dip-buying activity and improving legislative sentiment.
What Do On-Chain Metrics Reveal About Market Stress?
On-chain indicators suggest Bitcoin is approaching conditions historically associated with major bottoms, although confirmation remains incomplete. One of the most closely watched metrics tracks the number of coins being held at a loss. On-chain data shows that 10.46 million BTC are currently underwater.
Historically, Bitcoin has often formed major bottoms when more than 10 million coins were sitting at a loss. While this reflects significant stress across the market, analysts generally view the metric as a supporting signal rather than a standalone confirmation tool. Technical and on-chain indicators still have not aligned fully.
Another important metric is realized losses. Bitcoin’s realized losses currently stand at approximately $174 billion. While substantial that figure remains below the $211 billion recorded during the previous bear market, suggesting that current market stress has not yet matched the levels seen during the last major cycle downturn.
What Are Technical Indicators And Derivatives Data Showing?
Current indicators continue to provide a mixed picture. TradingView data places the Relative Strength Index (RSI) at 27, generating a buy signal commonly associated with oversold market conditions. Such readings can indicate that selling pressure is becoming exhausted and that a short-term rebound remains possible.
At the same time, the MACD level remains at -4,002, maintaining a sell signal and highlighting persistent bearish momentum. The 100-day Simple Moving Average stands at $72,954, remaining significantly above current prices and continuing to indicate broader weakness. The Average Directional Index (ADX) is currently at 45.
From a technical perspective, an ADX reading above 25 generally indicates relatively strong trend strength, showing that the prevailing market trend remains firmly established. Bitcoin technical analysis therefore suggests that oversold conditions may be supporting the latest recovery, but broader trend indicators have yet to confirm a decisive change in market direction.
Derivatives activity further highlights ongoing leverage. Bitcoin futures trading volume reached approximately $70.9 billion during the reporting period, while Bitcoin futures liquidations totaled roughly $71.5 million. CoinGlass data also shows that 104,063 traders were liquidated over the past 24 hours, resulting in total liquidations of $300.73 million.
Could The Recent Recovery Turn Into A Bull Trap?
The possibility remains under discussion because confirmation signals continue to point in different directions. Bitcoin technical analysis highlights several constructive developments. The more than 4% rebound on June 7 demonstrated active dip-buying interest, while the RSI’s oversold reading suggests conditions that have historically supported relief rallies.
However, rising open interest, elevated leverage and persistent negative ETF flows indicate that risks remain present beneath the surface. If buying momentum weakens while speculative positioning continues to increase, the market could face renewed liquidation pressure. Current signals therefore support caution rather than certainty.
What Signals Could Confirm The Next Major Move?
Several indicators may help determine whether Bitcoin is forming a sustainable bottom or preparing for another decline. For a stronger bullish case, traders are watching for sustained positive ETF inflows, a decline in leverage while prices rise, improving momentum indicators and a successful reclaim of the 100-day Simple Moving Average at $72,954. Additional signs of accumulation would further strengthen the recovery narrative.

Bitcoin Technical Analysis: Is BTC’s $60K Support a Bull Trap as $55K Risk Grows? 4
On the bearish side continued negative ETF flows, rising open interest alongside weakening price action, elevated funding rates and renewed liquidation events could increase downside risks. Market participants are also monitoring whether realized losses continue moving closer to levels seen during previous bear-market capitulation phases.
Conclusion
Bitcoin technical analysis continues to present a mixed outlook as the market attempts to stabilize above $60,000. Several indicators suggest Bitcoin may be approaching conditions historically associated with major bottoms but the evidence remains incomplete.
Bitcoin is currently trading around $63,233.18 while total open interest remains elevated near $45.38 billion. At the same time ETF flows remain negative, 10.46 million BTC are underwater and realized losses stand at $174 billion compared with $211 billion during the previous bear market.
The latest rebound demonstrates that buyers remain active near key support levels. However stronger confirmation through sustained inflows, healthier market positioning and better alignment between technical and on-chain indicators may be required before a durable bottom around $60,000 can be identified with greater confidence.
Glossary
Open Interest (OI): Number of active futures positions in the market.
Bull Trap: A false rally that is followed by a price drop.
Funding Rate: Fee between futures traders that signals market bias.
Long Liquidation: Forced closure of buy positions during a decline.
On-Chain Data: Blockchain metrics that track network and investor activity.
Frequently Asked Questions About Bitcoin Technical Analysis
Why is the $60,000 level important for Bitcoin?
The $60,000 level is a key support area that could help prevent a larger price decline.
What do positive funding rates indicate?
Positive funding rates indicate that many traders are still expecting Bitcoin prices to rise.
How much has Bitcoin Open Interest increased recently?
Bitcoin Open Interest increased by nearly $1 billion over the past three days.
Could Bitcoin fall to $55,000?
Yes Bitcoin could fall to $55,000 if the $60,000 support level fails to hold.
What could strengthen Bitcoin’s recovery?
Stronger capital inflows and higher buying demand could support a more sustainable recovery.
Sources –
AMBCrypto
Coinmarketcap
Tradingview
Coinglass
Read More:Bitcoin Technical Analysis: Is BTC’s $60K Support a Bull Trap as $55K Risk Grows?">Bitcoin Technical Analysis: Is BTC’s $60K Support a Bull Trap as $55K Risk Grows?