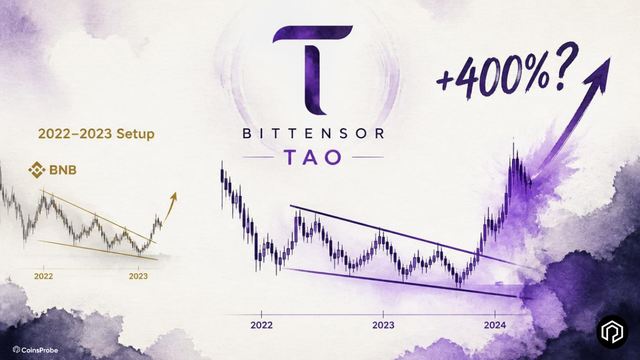
Key Highlights TAO is trading at $236.34 — up 17.39% over 30 days — pressing against the upper boundary of a 952-day bullish wedge flag that matches BNB's 2022–2023 compression in duration, s
Key Highlights
- TAO is trading at $236.34 — up 17.39% over 30 days — pressing against the upper boundary of a 952-day bullish wedge flag that matches BNB's 2022–2023 compression in duration, structure, and measured-move logic.
- BNB's equivalent 952-day base resolved into a +400% rally from ~$250 to ~$1,300 — the fractal that analyst @CryptoBullet1 is applying to TAO's current weekly chart.
- $270 is the breakout trigger (weekly close required), $183 is the invalidation level — and the Fibonacci extension map projects $748 → $1,230 → $2,200 if the pattern completes.
Bittensor’s weekly chart is attracting serious technical attention — not because of a recent catalyst, but because of how long nothing has happened. TAO has been compressing inside a bullish wedge flag for 952 days — and that duration, combined with a structural match to BNB’s 2022–2023 base, is what analyst flagged on September 12, 2026 as a setup that “will be massive” if it breaks.
At $236.34 — up 1.06% in 24 hours and 17.39% over 30 days with a market cap of $2.67 billion — TAO is sitting close enough to the wedge’s upper boundary that the breakout window is opening. But it has not broken yet.
 Bittensor (TAO) Price on 13 Sept 2026 | Source: Coinmarketcap
As covered in our Bittensor TAO surge catalysts and price targets analysis, the near-term momentum behind TAO has been driven by the Solana BUTT/TAO demand loop creating a new bid channel for the token — a fundamental catalyst that now sits beneath a weekly chart compressing toward one of its most significant technical decision points since the 2024 all-time high.
The BNB Fractal — 952 Days, Then +400%
In 2022–2023, BNB spent 136 weekly candles (952 days) grinding inside a descending, contracting structure — a bullish wedge flag where selling pressure faded as the range tightened. When the upper trendline finally gave way, the move was not a modest bounce. BNB ran from approximately $250 to $1,300 — a +400% advance over multiple quarters.
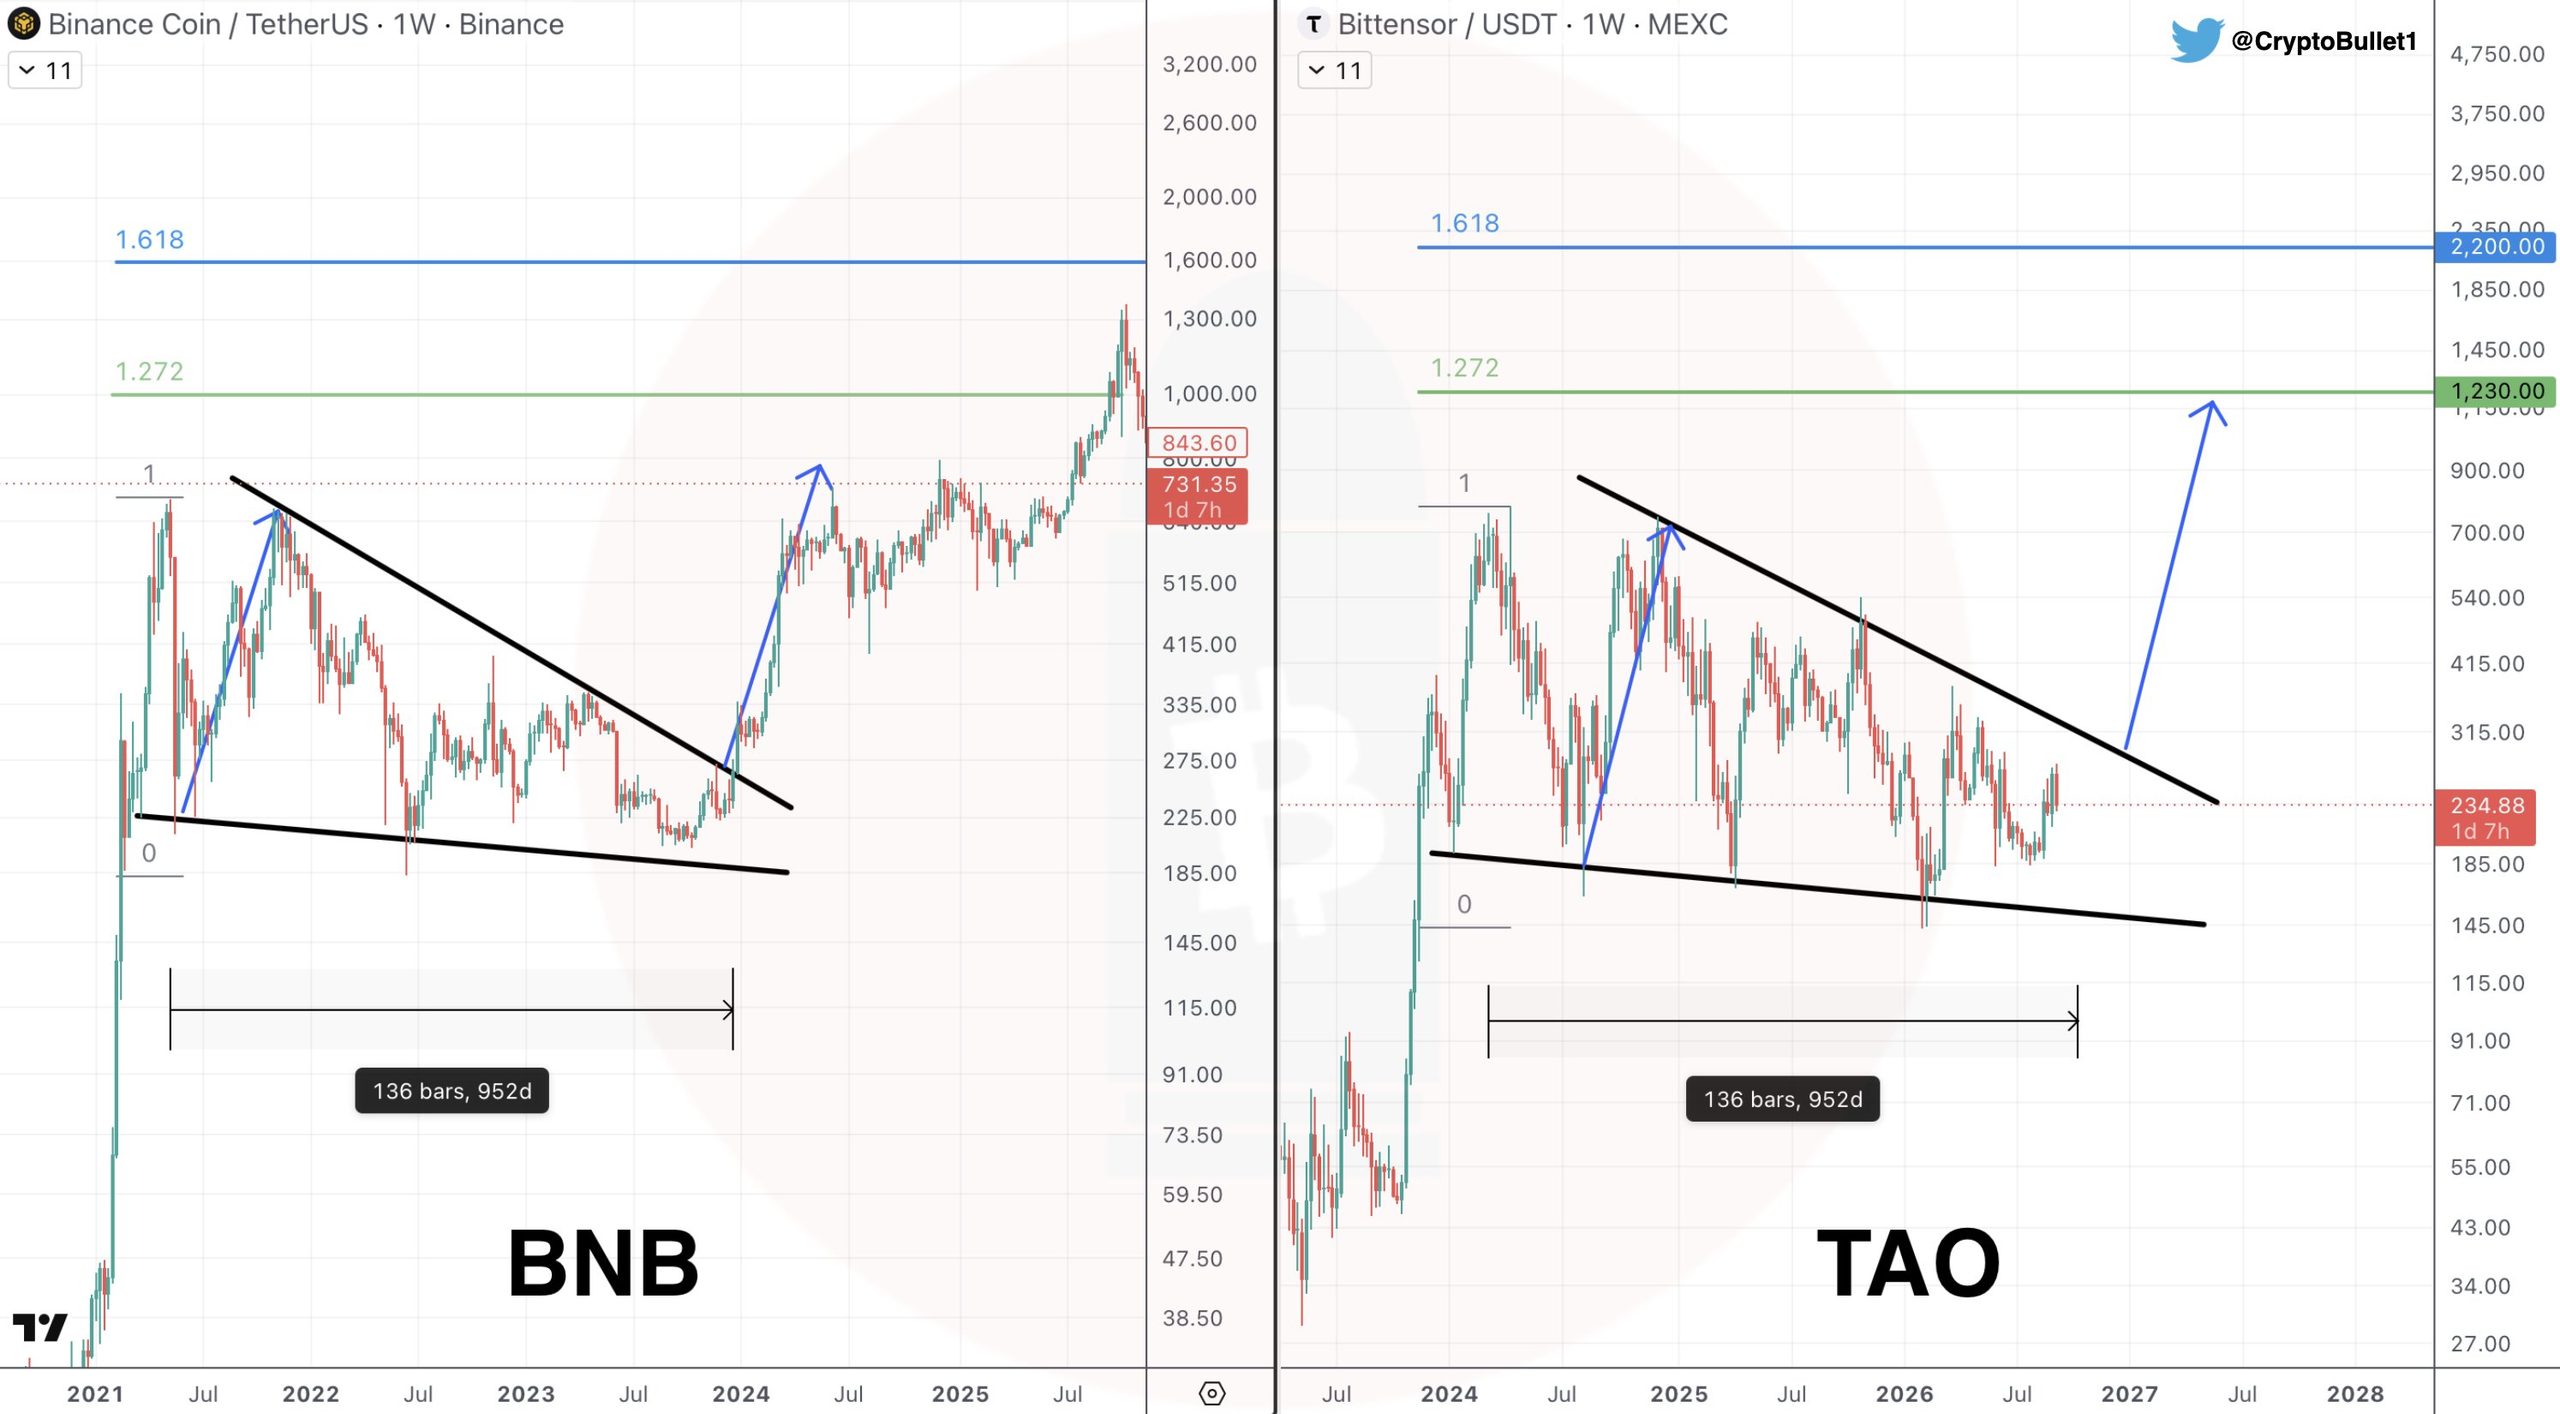 BNB and TAO Fractal Chart | Source: @CryptoBullet1 (X)
That sequence is the exact reference @CryptoBullet1 is applying to TAO. The side-by-side weekly comparison posted on September 12 shows four matching elements:
ElementBNB 2022–2023TAO 2024–2026TimeframeWeeklyWeeklyDuration136 bars / 952 days136 bars / 952 daysStructureFalling wedge/flagFalling wedge/flagMeasured-move logicFibonacci extensions from baseFibonacci extensions from base
CryptoBullet described TAO’s structure as a “giant chopsolidation” that “really reminds me of $BNB in 2022–2023” — with an earlier note calling the 900-day range a setup that targets $1,230 and $2,200 in 2027–2029 if the break occurs.
Fractals are pattern rhymes, not guarantees. But when duration, shape, and apex location align this precisely, traders treat the comparison as a high-priority setup rather than a casual observation.
TAO Weekly Chart — Compression Structure and Breakout Levels
On the TAO/USDT weekly chart, the bullish wedge flag shows:
- A descending resistance line connecting progressively lower highs since the 2024 cycle peak near $768
- A shallow declining support line beneath higher-low attempts
- Price currently pressing the upper boundary after 952 days of compression
At $236, TAO is sitting just below the immediate breakout zone at ~$270. Until a weekly close above $270 is achieved, the pattern remains a setup in progress — not a confirmed expansion.
The Fibonacci extension map drawn from the structure projects three upside magnets if the breakout holds:
LevelPriceRoleBreakout zone~$270Trigger / invalidation of the compression1.0 extension$748First full measured objective1.272 extension$1,230Mid-cycle expansion target1.618 extension$2,200Stretch / cycle-high objective
Those $1,230 and $2,200 levels are the same objectives CryptoBullet previously flagged for 2027–2029. The $748 handle is the nearer 1.0 measured move if the wedge resolves upward from current prices.
Context matters. TAO is the native asset of Bittensor, a decentralized network that rewards useful machine-learning work across specialized subnets, with a Bitcoin-like 21 million max supply and a first halving already completed in December 2025. That fundamental backdrop is why a multi-year base on TAO attracts “infrastructure trade” framing rather than a pure meme-chart comparison. Still, the trade itself is technical: compression, duration, and a defined trigger.
Why TAO Attracts Infrastructure Framing, Not Just Chart Speculation
TAO is the native asset of Bittensor — a decentralized network that rewards useful machine-learning work across specialized subnets. Key fundamentals that differentiate the multi-year base from a pure meme-chart setup:
- 21 million maximum supply — Bitcoin-like hard cap
- First halving completed December 2025 — reducing new token issuance
- Subnet architecture — incentivized specialized AI/ML work rather than generic compute
The combination of a deflationary supply schedule and a growing decentralized AI network is why analysts frame a confirmed TAO breakout as an infrastructure trade rather than a speculative punt. The chart provides the trigger. The fundamentals provide the thesis.
Bullish vs. Bearish Scenarios
Bullish Scenario — $270 Weekly Close/Descending Resistance Trendline Confirms the Breakout
TAO produces a sustained weekly close above $270/Descending Resistance Trendline with expanding volume — the same confirmation that validated BNB’s wedge resolution. The 952-day compression resolves upward, activating the stepwise Fibonacci map:
$270 → $748 (1.0x) → $1,230 (1.272x) → $2,200 (1.618x)
A brief wick through $270 that fails back inside the wedge is a fakeout — not a breakout. Weekly close confirmation with volume is the requirement.
Bearish Scenario — $183 Loss Postpones the Thesis
The $183 support zone — the lower boundary of the long-term structure — is the level that keeps the breakout attempt alive. A sustained weekly close below $183 would:
- Delay the $270 trigger
- Shift TAO back to range trading inside the wedge
- Open room for a deeper lower-trendline test before expansion can be trusted
Losing $183 does not erase the multi-year base — it postpones the BNB fractal rather than confirming it.
Bottom Line
TAO is not breaking out yet. It is finishing a 952-day bullish wedge flag that matches BNB’s 2022–2023 consolidation — the base that preceded a +400% run from ~$250 to ~$1,300. At $236, the wedge apex is close enough that the market is beginning to price the attempt.
Descending Resistance Trendline is the attack level. $183 is the defense level. Until one of those gives way, TAO is a compression trade — tight risk below the base, asymmetric upside if the BNB rhyme repeats.
Disclaimer: The views and analysis presented in this article are for informational purposes only and reflect the author’s perspective, not financial advice. Technical patterns and indicators discussed are subject to market volatility and may or may not yield anticipated results. Investors are advised to exercise caution, conduct independent research, and make decisions aligned with their individual risk tolerance.
Also Read: XRP Drops From $1.70 to $1.35 — Is the Rebound to $1.60 Still Alive?