Traders and market watchers are paying fresh attention to BNB price prediction as the coin works to keep its upward momentum going after riding a clear ascending trendline. Over the past few
Traders and market watchers are paying fresh attention to BNB price prediction as the coin works to keep its upward momentum going after riding a clear ascending trendline.
Over the past few days, BNB has consistently made higher lows, pulling the price back up toward its recent peaks.
Right now, BNB is hovering near $598.11, resting just above its immediate trendline while buyers look toward higher resistance targets.
How price behaves around these critical chart boundaries over the next few hourly sessions will determine whether we see a bigger breakout or a temporary cooling-off period.
Technical analysis prepared by CoinGabbar's crypto research desk. This piece is for informational purposes only and is not financial advice. CoinGabbar and the analyst do not hold a position in BNB at the time of publication.
The levels described here apply strictly to the 1-hour timeframe covered and should be rechecked if the price closes beyond the stated range.
Trend and Momentum: Key Takeaways
$BNB continues to respect a rising support line, bouncing cleanly off three separate trendline touches on its way up.
Price is currently sitting right around dynamic trendline support while fighting to break and close above the $602.78 hurdle.
A solid candle close above $602.78 could clear the path toward a major extended target at $632.77.
A minor dip toward $596.64 serves as a natural pullback level within the trend structure. However, a close below the $588.11 breakdown level invalidates the immediate bullish idea, opening room for a slide down to $581.62 and $573.75.
RSI holding near 53.83 remains in stable territory above the midpoint, though a subtle bearish divergence warns that momentum is slowing slightly near recent swing highs.
Derivatives liquidations heavily favor short sellers on 12-hour ($537.64K) and 24-hour ($609.84K) charts, while shorter timeframes show minor long liquidations.
$BNB Price Right Now
Metric
Value
Price
$598.11
24h Change
+1.36% (+$8.0252)
Market Cap
$79.50B
Futures Volume (24h)
$711.83M
Spot Volume (24h)
$103.55M
Open Interest
$981.99M
Circulating Supply
133.16M
Total Supply
133.16M
Max Supply
133.16M
Open interest is the total value of derivative contracts still open across exchanges, a rough gauge of active leveraged positioning.
Chart source: BNB/USDT 1-hour perpetual contract, TradingView, Binance data feed, captured August 5, 2026, around 04:57 PM UTC+5:30.
Market cap, volume, and supply data from BNB market data on CoinGlass were captured the same day.
Methodology and Data Sources
This price structure analysis relies on the 1-hour chart to track market swings, combining volume, open interest, and market valuation stats from CoinGlass.
Liquidation data comes straight from CoinGlass tracking tools, alongside on-chain network metrics sourced from Token Terminal.
Technical levels are only considered invalidated when a candle firmly closes beyond a trigger price, rather than just poking through with a quick wick.
$BNB Chain Milestone: Flips Tron as Top Network for Stablecoin Holders
Fundamental growth provides an encouraging backdrop for this BNB price prediction.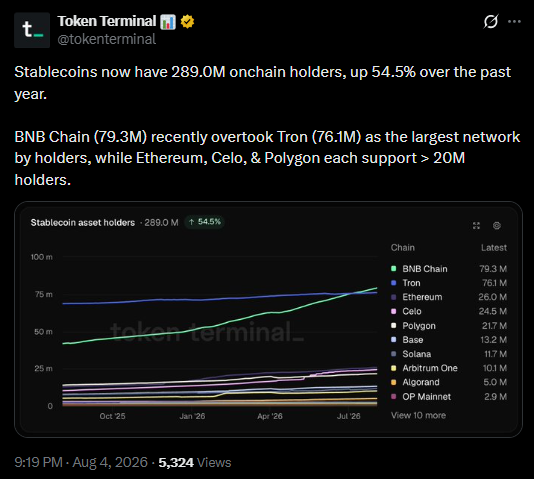
Recent chain analytics from Token Terminal show that global stablecoin holders across all smart contract platforms hit 289.0M, jumping 54.5% year-over-year.
More importantly for Binance ecosystem watchers, BNB Chain reached 79.3M stablecoin holders, passing Tron (76.1M) to claim the top spot globally. Real user growth and steady stablecoin activity often act as a strong floor when a token tries to build upward momentum.
Source: Token Terminal analytics, posted August 4, 2026.
Liquidation Snapshot
Derivatives data shows a noticeable tilt toward short liquidations once you look past short-term noise.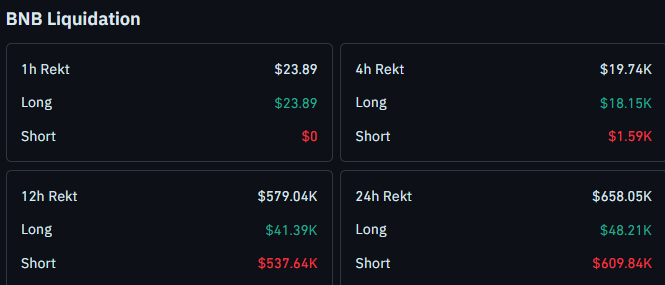
The 1-hour chart saw a negligible $23.89 flushed out, entirely from long trades. The 4-hour window logged $19.74K in total liquidations, splitting into $18.15K longs versus $1.59K shorts.
Zooming out reveals where the real pressure lies. The 12-hour chart registered $579.04K in wiped positions, with shorts taking $537.64K of that loss against just $41.39K from longs. On the 24-hour view, total liquidations reached $658.05K, heavily dominated by $609.84K in short liquidations compared to $48.21K in long positions.
Source: BNB liquidation data, CoinGlass, checked August 5, 2026.
Is BNB Ready for a Breakout, or Is Momentum Fading?
Can this trendline bounce carry BNB well past $600, or are sellers going to step in and push prices down? The chart is standing right at a fork in the road.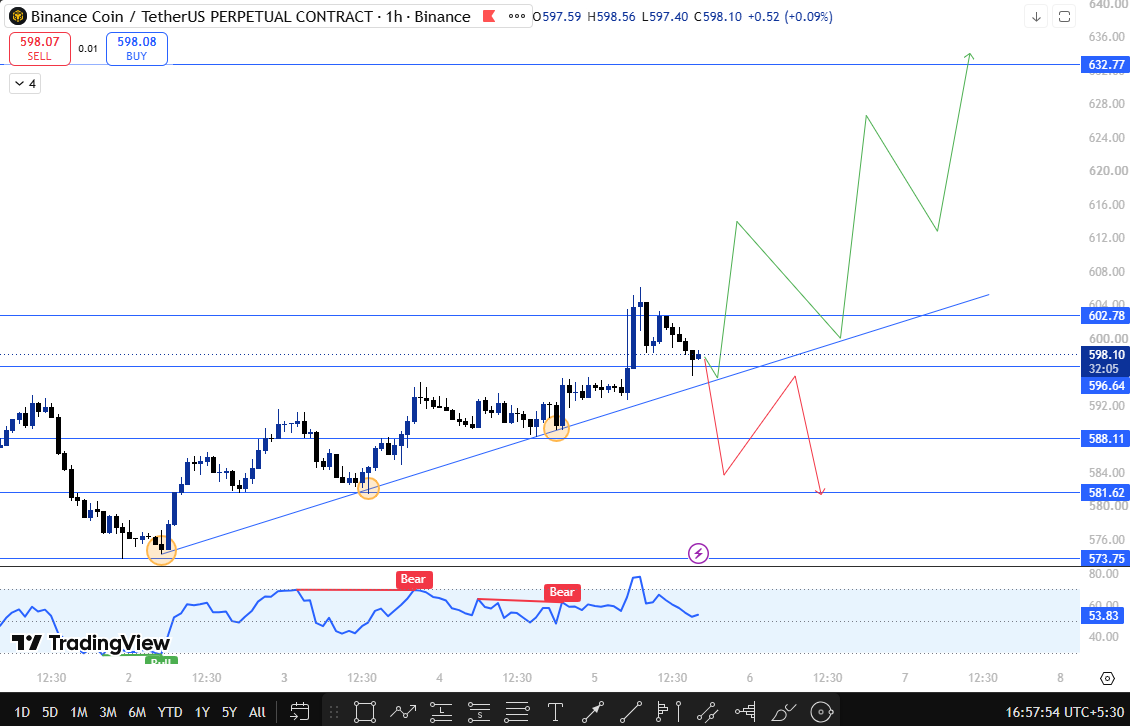
BNB has been climbing along an ascending trendline on the hourly timeframe, building higher lows step by step.
However, the price paused right beneath resistance at $602.78 and pulled back slightly.
The key level to keep an eye on is $602.78. A confirmed break and hold above $602.78 proves buyers are still in charge, opening up a direct path toward $632.77.
On the downside, a minor move to $596.64 acts as a healthy pullback zone within the ongoing trend. But if the price breaks down and closes below the $588.11 breakdown level, the short-term bullish picture breaks apart, exposing lower targets at $581.62 and $573.75.
The RSI sitting around 53.83 shows buyers still hold an edge above 50, but the lower peaks on the oscillator relative to recent price highs point to a subtle bearish divergence.
Traders should wait for a decisive closing candle past key levels to confirm the next direction.
Glossary
Ascending Trendline: An upward-sloping line connecting progressively higher low points on a price chart, offering dynamic support during a rally.
Pullback Level: A temporary price drop or dip within a larger ongoing uptrend.
RSI Divergence: A setup where price and the RSI indicator move in opposite directions, often signaling that momentum is slowing.
Open Interest: The total value of all active, unsettled futures or options contracts currently open in the market.
Liquidation: The automatic closing of a trader's leveraged position by an exchange due to insufficient margin.
Technical Outlook Snapshot
Indicator
Signal
Trend
Holding above a rising trendline with higher lows established
Structure
Testing resistance at $602.78; $596.64 acts as shallow pullback support.
Momentum Oscillator RSI
Hovering at 53.83, maintaining a neutral-to-bullish stance with mild divergence
Liquidations
Minor long wipes short-term; heavy short liquidations on 12h/24h views
Support and Resistance Levels to Watch
Type
Level
Note
% From CMP
Extended Target
$632.77
Major upside objective on a full breakout run
+5.79%
Trigger Resistance
$602.78
Immediate breakout hurdle; needs a close above
+0.78%
Current Price
$598.11
Hovering right along upward trendline support
—
Pullback Support
$596.64
Shallow pullback level within the trend
-0.25%
Breakdown Trigger
$588.11
Key breakdown level; closing below invalidates the setup
-1.67%
Support 1
$581.62
Next logical support level if breakdown occurs
-2.76%
Lower Support
$573.75
Key swing low support zone
-4.07%
Risk-Reward Table
Case
Trigger
Target
Bull Case
Breaks & sustains above $602.78
Push toward $632.77
Bear Case
Closes below $588.11
Drop toward $581.62 and $573.75
What Would Change This BNB Price Prediction?
The market remains in wait-and-see mode while BNB trades between the $596.64 pullback zone and $602.78 resistance.
A clear candle close above $602.78 validates the trendline bounce and shifts attention toward $632.77.
On the flip side, losing the $588.11 breakdown level on a closing basis cancels the bullish bias, pointing toward a retest of $581.62 or lower.
How Bitcoin Sentiment Could Move BNB Higher
While this technical breakdown focuses on BNB's chart setup, Bitcoin continues to dictate overall crypto market direction.
If Bitcoin remains steady or trends upward, BNB has a much cleaner shot at breaking past $602.78. However, any sudden market-wide sell-off led by Bitcoin could force BNB under its $588.11 breakdown mark, dragging price toward lower support zones.
When This BNB Price Prediction Gets Revisited
This BNB price prediction will be updated once price closes above $602.78 or below $588.11, or if the price stays locked in a tight range for 24 hours without breaking out.
Bull, Base, and Bear Case
Bull Case: A break and sustain above $602.78 triggers an extension leg toward $632.77.
Base Case: Price holds above the $596.64 pullback line, consolidating under $602.78 while building strength.
Bear Case: A candle close below $588.11 confirms breakdown momentum down toward $581.62 and $573.75.
Disclaimer
This Binance coin price prediction is based on technical chart analysis and market data available at the time of writing. Cryptocurrency markets are highly volatile, and prices can change rapidly. This content is for informational purposes only and should not be considered financial advice. CoinGabbar and the analyst do not hold a position . Always do your own research and consult a qualified financial advisor before making any investment decisions.