Bonk launched in late 2022 as a Solana-based meme coin and built its early reputation on community-driven distribution. It has since grown into one of the more actively traded meme tokens on
Bonk launched in late 2022 as a Solana-based meme coin and built its early reputation on community-driven distribution.
It has since grown into one of the more actively traded meme tokens on the network, with price cycles that mirror broader Solana ecosystem sentiment.
This Bonk price prediction looks at where $BONK stands after a firm start to the week.
The Bonk price today is $0.00000281, and up 1.0% over the past 24 hours. Price moved between $0.00000269 and $0.00000285 during that stretch.
Market capitalization stood at $247.481 million, with BONK's fully diluted valuation matching that figure exactly.
Live Market Data
Metric
Value
Price
$0.00000281
24h Change
+1.0%
24h Range
$0.00000269 - $0.00000285
Market Cap
$247.481M
Fully Diluted Valuation
$247.481M
24h Trading Volume
$27.852M
Total Value Locked
$10.897M
Circulating Supply
87.995T
Total Supply
87.995T
Max Supply
87.995T
Source: BONK market data taken from CoinGecko, as of Sep 12, 2026. Figures may vary slightly across other tracking websites.
BONK's circulating, total, and max supply all sit at the same 87.995 trillion mark.
That means the entire token supply is already in circulation, removing future dilution as a factor in this Bonk price prediction September 2026.
Exchange Volume
Futures trading in BONK is led by OKX, which recorded $2.54 million in 24-hour volume.
LBank followed at $1.28 million, with Bitunix close behind at $1.02 million. Gate added $668,820, while WhiteBIT and Coinbase contributed $333,680 and $244,810 respectively. 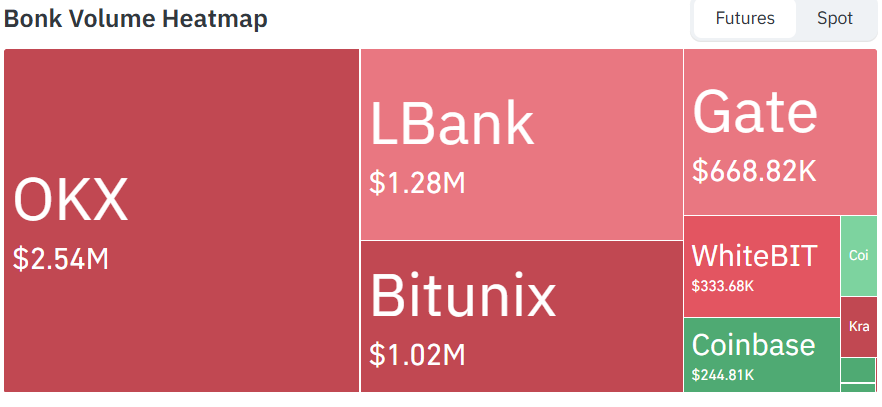
Source: Volume Heatmap Data Taken From CoinGlass, As of Sep 12, 2026.
Anyone tracking bonk news today will notice OKX alone handles a large share of derivatives flow. That concentration can make BONK more sensitive to positioning shifts on that single exchange.
Technical Analysis
BONK has traded inside a rising ascending channel on the daily chart since early August.
Higher lows and higher highs continue to define the structure. Price is currently working through the lower-middle section of that channel.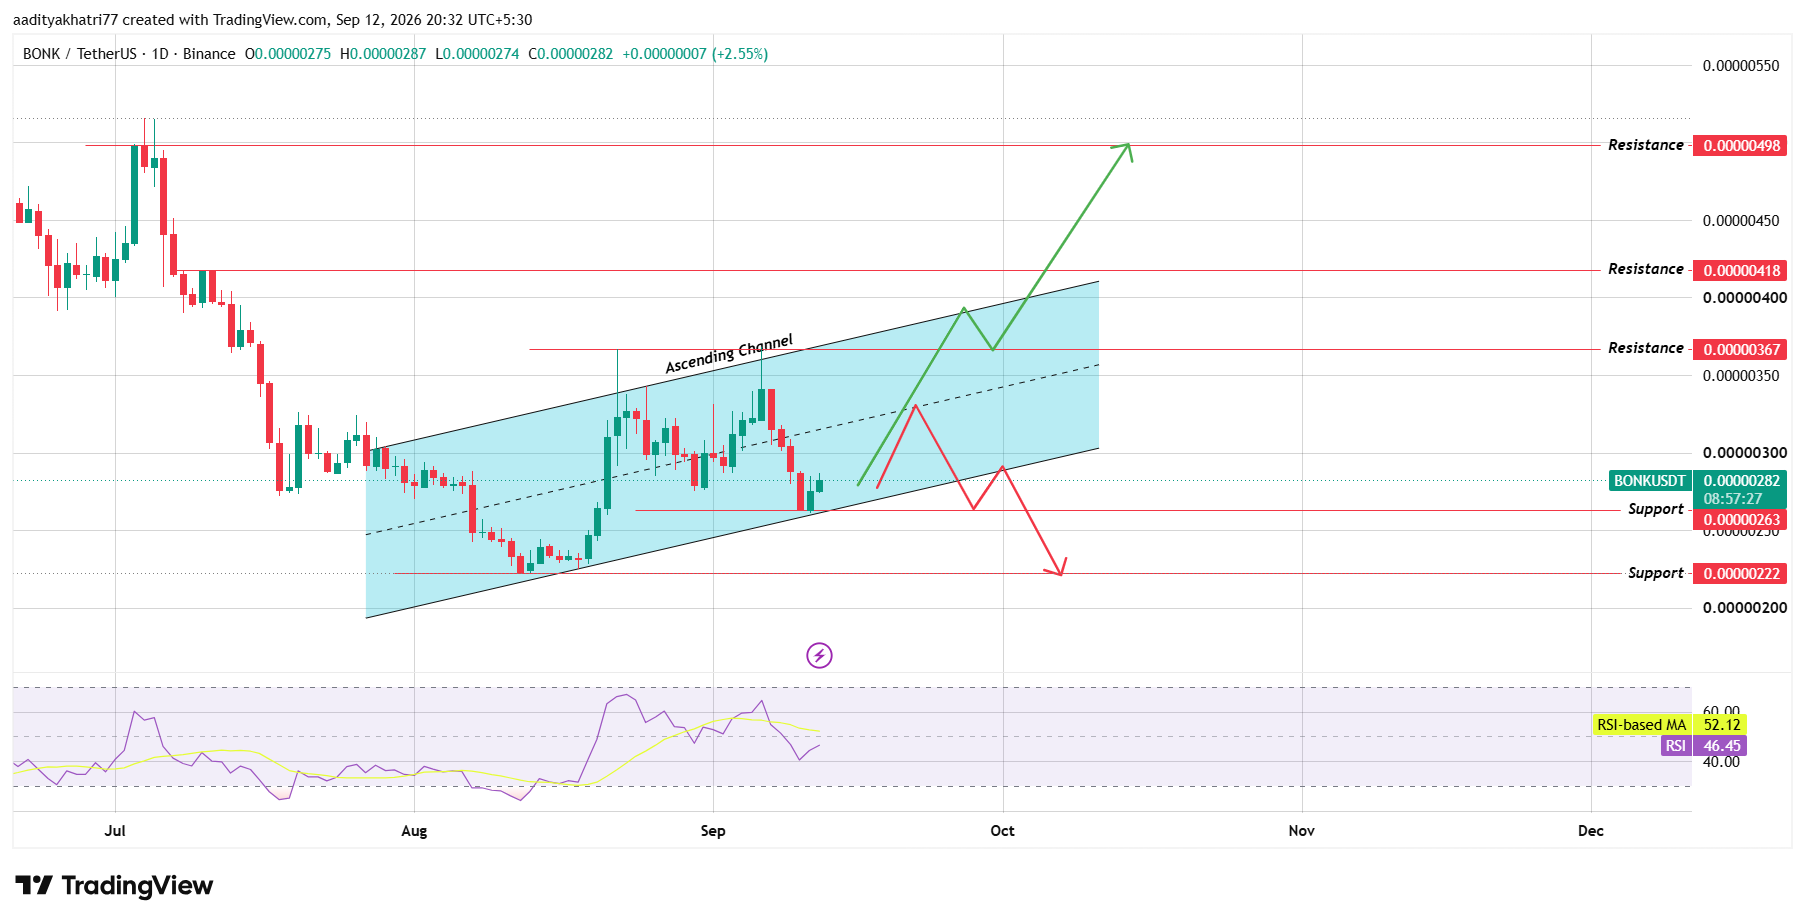
Source: Chart Taken From TradingView.
The RSI reads 46.45, sitting just below its own 14-period moving average of 52.12. That reading points to momentum that has cooled slightly without turning bearish.
Can $BONK Reverse Higher And Break Resistance?
A bounce from current levels would first need to clear the nearest resistance at $0.00000367 on a closed candle with volume above the recent average.
Following that with a break above the ascending channel's upper boundary would open room toward $0.00000418, and then the higher resistance band at $0.00000498.
Bonk technical analysis on this timeframe suggests the RSI would need to reclaim its moving average to support that move.
What Happens If $BONK Gets Rejected At Resistance?
If BONK fails to clear $0.00000367 and instead slides back toward the channel's lower boundary, the outlook shifts.
A confirmed break of that trendline would turn the picture bearish. That scenario would likely send price toward support at $0.00000263, with a deeper floor near $0.00000222 if selling pressure continues.
Rejection at resistance followed by a trendline break would also pull the RSI back below the 40 zone, reinforcing the bearish case.
Support And Resistance Levels
Support
Resistance
$0.00000263
$0.00000367
$0.00000222
$0.00000418
$0.00000498
Bull, Base, And Bear Scenarios
Scenario
Setup
Level
Bull
Bounce clears first resistance and channel's upper boundary with volume
$0.00000498
Base
Price holds inside the ascending channel, no confirmed break either side
$0.00000263 - $0.00000367
Bear
Rejection at resistance followed by a confirmed break of channel support
$0.00000222
Bonk Vs Bitcoin
BONK's ascending channel has formed during a period of relatively calm Bitcoin trading, and the two have moved with a loose but noticeable correlation.
Meme coins built on Solana, including BONK, tend to amplify Bitcoin's moves rather than move independently..
A stronger Bitcoin trend in either direction would likely accelerate whichever scenario plays out on BONK's chart first.
Expert Opinion
Technical analysts following Solana-based meme tokens have generally pointed out that BONK's ascending channel remains intact as long as the lower boundary holds. That holds true on a closing basis.
Several traders covering bonk news have noted that a volume increase above the recent average would be the clearest signal of a genuine reversal higher. Without that, another failed test of resistance looks more likely.
Disclaimer: This Bonk price prediction is for informational purposes only and should not be treated as financial advice. Cryptocurrency markets, including meme coins like BONK, are highly volatile, and any price target discussed carries meaningful downside risk. Actual outcomes may differ substantially from the scenarios outlined above, and readers should conduct independent research before making any investment decisions.