Key Takeaways TIA’s reclaimed resistance still needs to become support. Rising trendline support sits near $0.44–$0.45. Fibre testing advances ahead of a mainnet rollout. TIA was trading just
Key Takeaways
- TIA’s reclaimed resistance still needs to become support.
- Rising trendline support sits near $0.44–$0.45.
- Fibre testing advances ahead of a mainnet rollout.
TIA was trading just above the $0.475-$0.476 zone at $0.4807 when Kraken’s daily chart was captured at 06:28 UTC on October 4. Its unfinished candle was up 1.65%, although trading on both sides of the level showed buyers had yet to establish a clear hold above it.
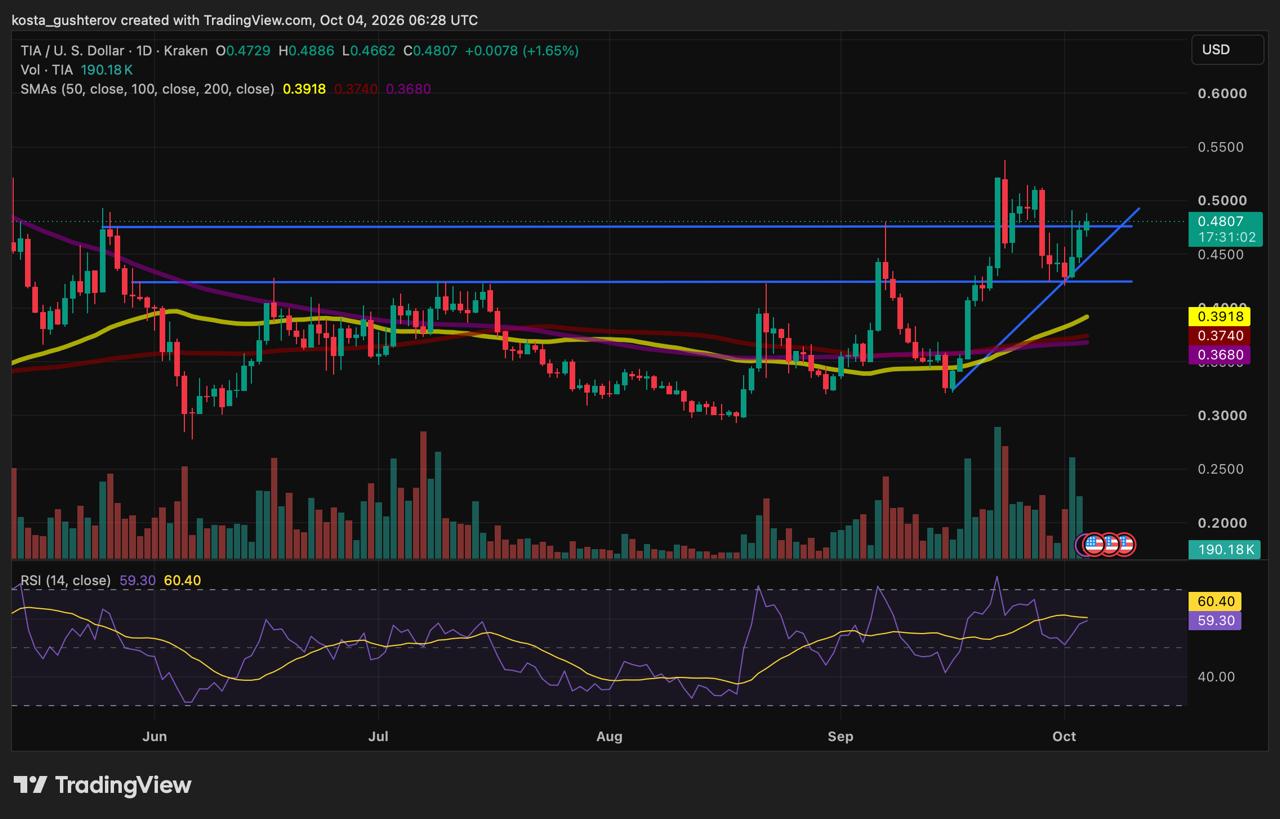
TradingView daily technical
chart for TIA/USD.
September’s failed hold raises the bar for this recovery
The zone resisted earlier advances, including in May and early September. TIA eventually cleared it on the way toward $0.54, but the subsequent decline took price back underneath. The latest attempt follows the wider altcoin gains covered in Coindoo’s October 1 market review, with that earlier reversal making a sustained hold especially important for TIA.
A daily close above the zone, followed by continued trading above it, would show buyers accepting prices beyond the old resistance. If a pullback then attracts buying around $0.475-$0.476, it would add evidence that the level is becoming support. That retest is useful if it occurs, but the recovery does not require price to return to the line immediately.
Holding above the zone would leave $0.49-$0.50 as the next resistance area, followed by September’s reaction highs around $0.51-$0.54. Only a move beyond the upper end, including the wick near $0.54, would extend the recovery past September’s peak. At the chart’s timestamp, TIA remained roughly 11% below that high.
A failed reclaim would put the rising trendline back in play
If TIA closes below the reclaimed zone and struggles to recover it, attention would shift to the rising blue trendline beneath price. The line connects September’s low near $0.32 with the later higher low around $0.425, projecting support near $0.44-$0.45 at the latest candles. That estimate rises with the line, so its position will change over time.
TIA area
Support reference
$0.475-$0.476
Reclaimed horizontal resistance; the immediate test.
$0.44-$0.45
Rising trendline near the latest candles.
Around $0.425
Horizontal support near the recent higher low.
$0.39-$0.40
50 SMA near $0.3918.
$0.368-$0.374
200 SMA near $0.368; 100 SMA near $0.374.
A break below the trendline would weaken the immediate advance, particularly if rebounds then stalled beneath it. Losing $0.425 afterward would do more damage because it would break the recent pattern of higher lows. These are separate tests: a brief move through the diagonal line would not, by itself, erase the broader recovery.
The daily moving averages still favour that recovery. TIA is above all three, with the 50 SMA above the 100 SMA and 200 SMA, although they sit too far below price to confirm the immediate support test. Momentum is less emphatic: the relative strength index, which compares recent gains with losses, stands at 59.30, above its neutral midpoint of 50 but below its smoothing line at 60.40.
RSI has recovered from the latest pullback without regaining September’s overbought readings. Further improvement alongside price holding resistance as support would reinforce the rebound, especially with stronger trading volume in completed sessions. Today’s Kraken volume bar remains unfinished, so it cannot yet provide a like-for-like comparison with earlier full days.
What Celestia is improving beyond the price chart
Celestia’s recent development work concerns the service applications pay to use. It provides data availability: a way for blockchains to publish transaction data so participants can access the records needed to check their history.
A payment application, for example, could process transfers on its own blockchain and publish the associated data through Celestia. The application would remain responsible for determining whether payments are valid, while Celestia helps make the underlying records available. Increasing publication capacity could therefore support applications that generate more data than existing systems can comfortably handle.
Fibre is Celestia’s effort to expand that capacity. Its Mocha testnet activated v10 on September 24, followed by a notice asking validators to configure Fibre servers. The testnet allows changes to be tested before deployment on the live network.
On October 1, Celestia reported that Fibre averaged 3.07 terabits per second across 120 validators in a 143-second test covering data distribution and on-chain confirmation. That measures the data handled by the system, rather than the number of payments it executed.
The test used an experimental software version and settings that differ from the planned initial mainnet release. Celestia intends to introduce Fibre with capacity matched to early demand, then expand as usage grows. Its announcement did not provide a fixed launch date, leaving live deployment as the next development milestone to watch.
Paying applications are the link to TIA demand
Applications pay data-publication fees in TIA, which is also staked to secure the network. More capable infrastructure could attract additional applications, but the economic benefit depends on their actual spending. A throughput benchmark measures capacity; recurring publication activity and fees show how much of that service customers use.
Cheaper publication can encourage adoption while reducing fees per unit of data. At lower prices, more usage is needed to generate the same revenue. Tracking paying applications, the data they publish and their fees together would help assess whether Fibre expands demand for Celestia’s service. None of those measures translates mechanically into a higher token price.
October also brings a supply milestone
Alongside demand, TIA holders face an approaching change in its vesting schedule. Celestia’s published schedule implies that initial core contributors’ continuous vesting finishes around October 30, 2026. That would complete an ongoing release schedule, rather than introduce a new one-day cliff unlock.
New issuance remains separate from those allocated tokens becoming transferable. The November 2025 upgrade reduced annual inflation to approximately 2.5%, with further gradual reductions scheduled, while research and ecosystem vesting continues through year four. Staking rewards also add tokens to circulation, so completing contributor vesting would not end supply growth or determine whether existing holders sell.
READ MORE:
 Crypto Searches on Google Slump, but Bitcoin Still Draws Cash
The next close matters more than the small gain
A sustained hold above $0.475-$0.476 would leave September’s highs in view. Another failed reclaim would instead bring the rising trendline back into focus, testing whether buyers can preserve the higher lows behind the recovery.
This article is for informational purposes only and does not constitute investment advice. Technical levels reflect the October 4 chart and do not guarantee future price movements.
The post Celestia Price Eyes $0.54 as Fibre Moves Toward Mainnet appeared first on Coindoo.