Chainlink price prediction searches are spiking for a reason that goes well beyond the usual chart noise. LINK has just done something it had not managed to pull off cleanly in a while, and o
Chainlink price prediction searches are spiking for a reason that goes well beyond the usual chart noise.
LINK has just done something it had not managed to pull off cleanly in a while, and on top of that, a comparison making the rounds on crypto Twitter has traders throwing around numbers that sound almost too big to say out loud.
Whether or not that comparison holds up, the chart underneath it is telling its own story right now, and it is worth walking through carefully before anyone gets carried away. Here is the full picture.
Chainlink Price Today: Live Data and 24-Hour Change
LINK is changing hands at $13.136 at last check, up a sharp 8.22% on the day, adding close to a full dollar in value in a single session.
That kind of move rarely happens quietly, and the volume backs it up.
Futures volume over the past 24 hours sits at $850.70 million, dwarfing spot volume of $185.62 million, which tells you this rally has plenty of leveraged money riding along with it.
Chainlink's market cap is currently at $9.81 billion, with open interest at $764.78 million, a healthy jump that usually accompanies a breakout day like this one.
Circulating supply stands at 748.09 million LINK out of a fixed total and max supply of exactly 1 billion tokens, meaning close to three quarters of everything that will ever exist is already circulating, so this move is not being driven by any unusual supply shock.
Source: CoinGlass, LINK market data, accessed September 7, 2026.
Could LINK AND ONDO Really Do 20x On A 1990s Internet-Style Setup?
Here is where things get interesting beyond the chart.
A widely shared post from crypto commentator ALLINCRYPTO on X drew a comparison between crypto's current moment and the internet build out of the 1990s, asking whether LINK and ONDO could see 20x returns if history repeats.
The thread pointed to Cisco, which reportedly controlled more than 70% of the global networking infrastructure market before the internet reached mass adoption, and framed Chainlink and Ondo as playing a similar infrastructure role for crypto today.
It is a fun thought experiment, and it is easy to see why it caught fire online, since a 20x from current levels would put LINK somewhere in the neighborhood of $260 to $300, a number that sounds almost unbelievable next to today's price.
That said, comparisons like this are speculative narratives built on a loose historical parallel, not a forecast backed by fundamentals or a guaranteed outcome.
Nobody knows if crypto's adoption curve will actually mirror the internet's, and even if it does, there is no promise LINK plays the same role Cisco did.
It makes for compelling reading, and it is clearly adding fuel to the current rally in sentiment, but it belongs in the category of exciting possibility rather than something to bank on.
Source: Post by ALLINCRYPTO (@RealAllinCrypto) on X.
Quick Take: LINK Price Action At A Glance
CMP: $13.183 (4-hour chart, Binance)
Ascending channel breakout confirmed; price now trading above the channel's upper boundary
4-hour trigger: sustained support from 12.644 opens the path toward 15.001 and eventually 20.186.
Failure level: close below 12.057 risks a slide toward 10.895
Momentum oscillator reading near 77.28, sitting in stretched territory after the sharp move
Data timestamp: September 7, 2026, 4h Binance perpetual chart
Risk note: leveraged interest is elevated after an 8% daily gain, so a sharp pullback cannot be ruled out even within a bullish structure
Chainlink Technical Analysis September 2026: Channel Breakout In Focus
The 4-hour ChainLink to TetherUS perpetual chart on Binance shows LINK breaking cleanly out of a ascending channel it had been climbing inside of for several days.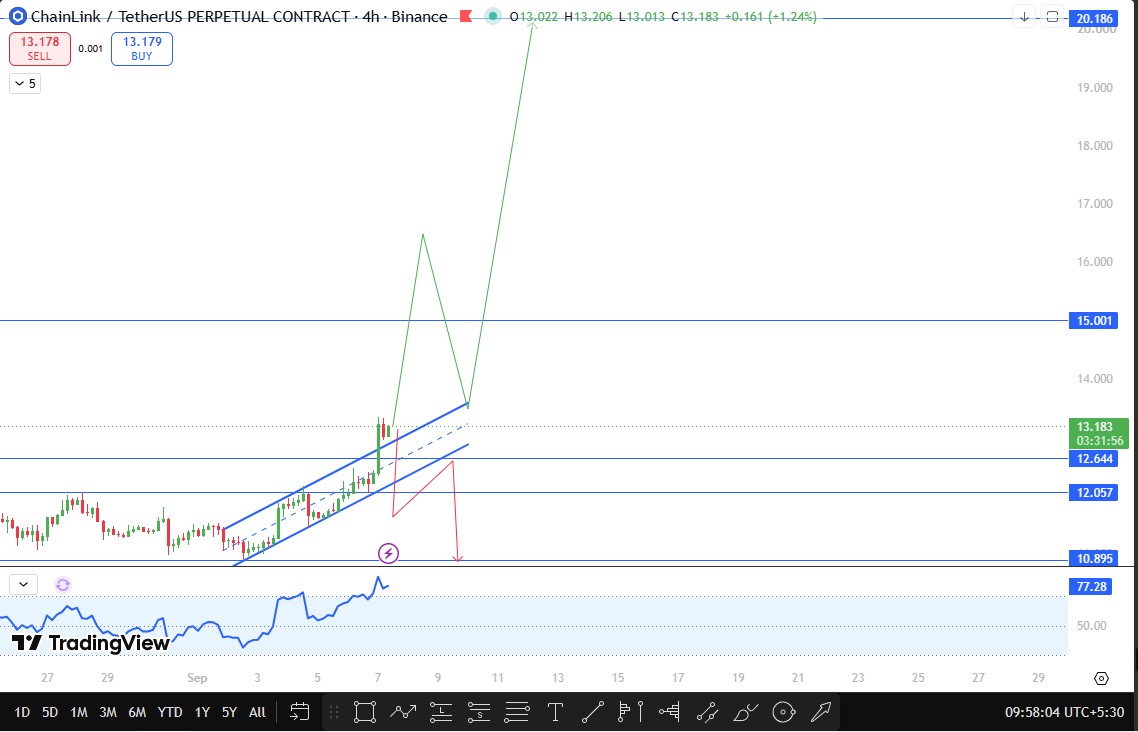
Price pushed through the upper boundary of that channel with a strong green candle, and the current price of $13.183 is sitting comfortably above where that channel top used to sit, which is exactly the kind of confirmation traders look for after a channel breakout.
The momentum oscillator on the chart is running hot at 77.28, well above the neutral 50 zone, reflecting just how forceful this move has been.
Readings this high do not automatically mean a reversal is coming, but they do suggest the next few candles matter for whether buyers can hold their ground or need to cool off first.
The level to watch now is 12.644, which lines up close to where the old channel boundary sits.
If LINK takes support from this zone and manages to sustain above it rather than slipping back inside the old channel, that would open the door to a run toward $15.001, a round number resistance zone that has not been tested in this cycle.
Clear through that, and the next stop on the chart is the major resistance at $20.186, a level that would represent a substantial move from here and would likely take multiple sessions with pullbacks along the way rather than one uninterrupted push.
On the flip side, if this breakout turns out to be premature and LINK closes below $12.057, that would mean the price has slipped back beneath the old channel structure entirely.
In that case, the next support to watch sits at $10.895, an area the chart already flagged with a sharp reversal marker as part of the broader setup.
A breakdown of that scale would likely coincide with the current stretched momentum reading finally cooling off hard.
Source: TradingView, LINK/USDT Perpetual, Binance, 4h chart, accessed September 7, 2026, 9:58 UTC+5:30.
Chainlink Support and Resistance Levels to Watch
Level Type
Price
Distance From CMP
Major Resistance
$20.186
+53.1%
Resistance 2
$15.001
+13.8%
Resistance 1
$12.644
-4.1%
Current Price
$13.183
—
Support 1
$12.057
-8.5%
Major Support
$10.895
-17.4%
Bull Case, Base Case, And Bear Case For LINK
The bullish path is fairly straightforward here.
As long as LINK keeps its footing above $12.644, buyers stay in control of the narrative, and a push toward $15.001 becomes the natural next step.
If that level gives way with real conviction behind it, $20.186 stops looking like a distant fantasy number and starts looking like a realistic medium-term target, especially with the current wave of social media attention adding extra buying interest.
The base case is that LINK spends some time digesting this move before deciding what comes next.
After an 8% single-day gain and a momentum reading this stretched, a period of consolidation somewhere between $12.644 and $15.001 would not be surprising at all, giving the market time to see whether the breakout has real staying power.
The bearish case shows up if this breakout ends up being a fakeout, something that has happened before with channel patterns that break out on hype-driven volume.
A close back below $12.057 would be the first warning sign, and if that gives way to $10.895, it would suggest the current excitement, including the viral 20x talk, ran ahead of what the chart could actually support.
Risks To This Chainlink Price Prediction
The single biggest thing to flag here is that the 20x comparison circulating online is a speculative narrative, not a guaranteed outcome, and treating it as anything more than an exciting possibility would be a mistake.
Elevated open interest after a sharp rally also raises the odds of a volatile shakeout in either direction, since leveraged positions tend to get squeezed hard when momentum shifts.
Broader market sentiment matters too, since a rally like this one can lose steam quickly if Bitcoin or the wider altcoin market turns risk off, regardless of how clean LINK's own chart looks right now.
Key Terms Explained
Ascending Channel: A price pattern formed by two parallel upward-sloping lines, with price moving between them, that often precedes a breakout in either direction once the pattern matures.
Open Interest: The total number of outstanding derivative contracts, such as futures, that remain unsettled, often used to gauge how much leveraged money is active in a market.
Momentum Oscillator: A technical indicator that measures the speed and strength of recent price moves, often used to identify when an asset may be overbought or oversold.
Disclaimer
This article is for informational purposes only and should not be taken as financial advice. Cryptocurrency markets are highly volatile, and price predictions, including any comparisons to historical technology cycles, are speculative and not guaranteed outcomes. Always conduct your own research before making any investment decisions.